

Question: II: Plotting of Basic Function. Plot the given function using MATLAB. Always label your graph. Basic: Plot functions in one graph Plot in on figure
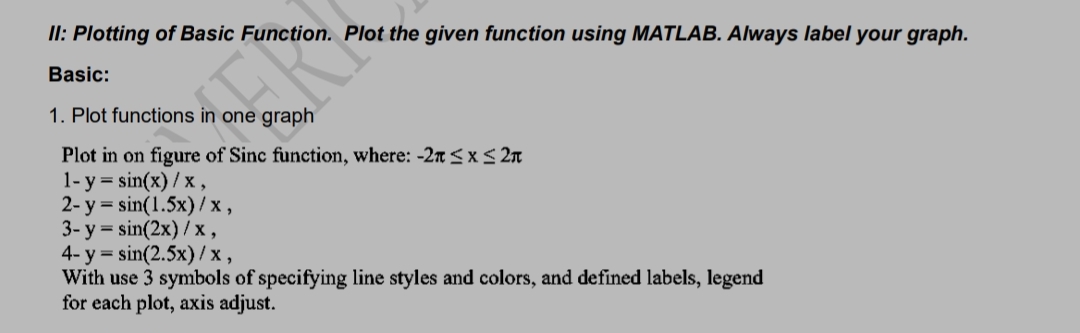
II: Plotting of Basic Function. Plot the given function using MATLAB. Always label your graph.
Basic:
Plot functions in one graph
Plot in on figure of Sinc function, where:
With use symbols of specifying line styles and colors, and defined labels, legend for each plot, axis adjust.
Step by Step Solution
There are 3 Steps involved in it
1 Expert Approved Answer
Step: 1 Unlock

Question Has Been Solved by an Expert!
Get step-by-step solutions from verified subject matter experts
Step: 2 Unlock
Step: 3 Unlock