

Question: II) Private Expenditures: Macro Data Figure 8.6 shows the cyclical behavior of private sector expenditures from 1947-2018. 9000 8000 CONSUMPTION 7000 OF SERVICES Consumption and
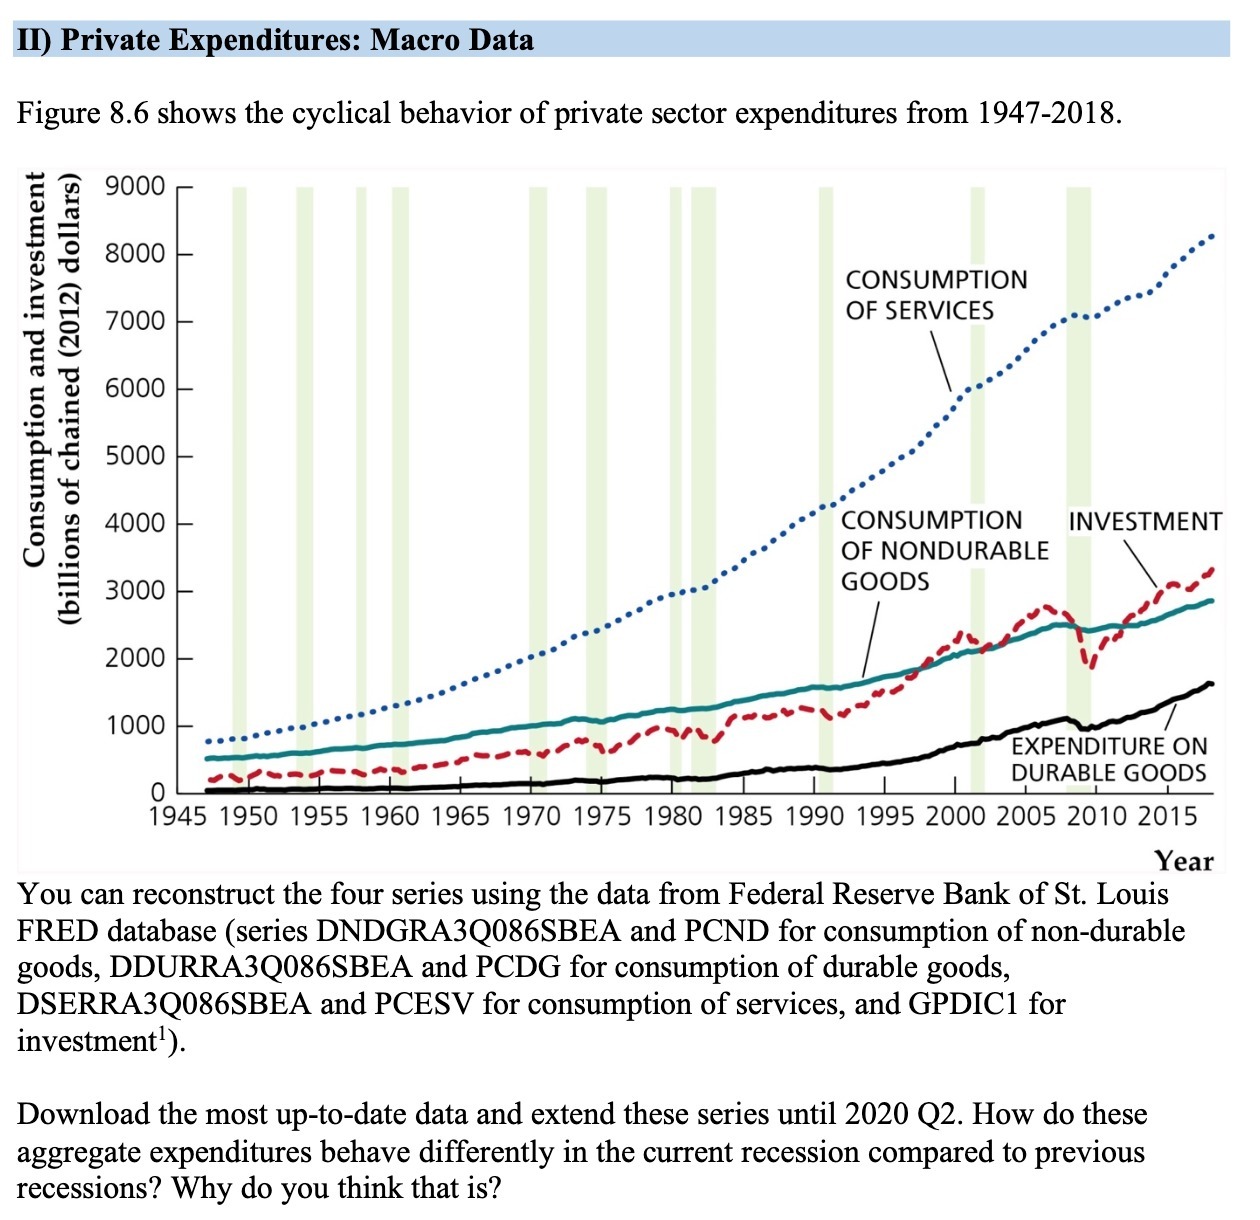
II) Private Expenditures: Macro Data Figure 8.6 shows the cyclical behavior of private sector expenditures from 1947-2018. 9000 8000 CONSUMPTION 7000 OF SERVICES Consumption and investment 6000 (billions of chained (2012) dollars) 5000 4000 CONSUMPTION INVESTMENT OF NONDURABLE 3000 GOODS 2000 1000 EXPENDITURE ON DURABLE GOODS 1945 1950 1955 1960 1965 1970 1975 1980 1985 1990 1995 2000 2005 2010 2015 Year You can reconstruct the four series using the data from Federal Reserve Bank of St. Louis FRED database (series DNDGRA3Q086SBEA and PCND for consumption of non-durable goods, DDURRA3Q086SBEA and PCDG for consumption of durable goods, DSERRA3Q086SBEA and PCESV for consumption of services, and GPDICI for investment ). Download the most up-to-date data and extend these series until 2020 Q2. How do these aggregate expenditures behave differently in the current recession compared to previous recessions? Why do you think that is
Step by Step Solution
There are 3 Steps involved in it

Get step-by-step solutions from verified subject matter experts