

Question: II. Problems - You have to show your work. No credit without an explanation (20 marks each). 1. Consider the following graph of TMSE vs.
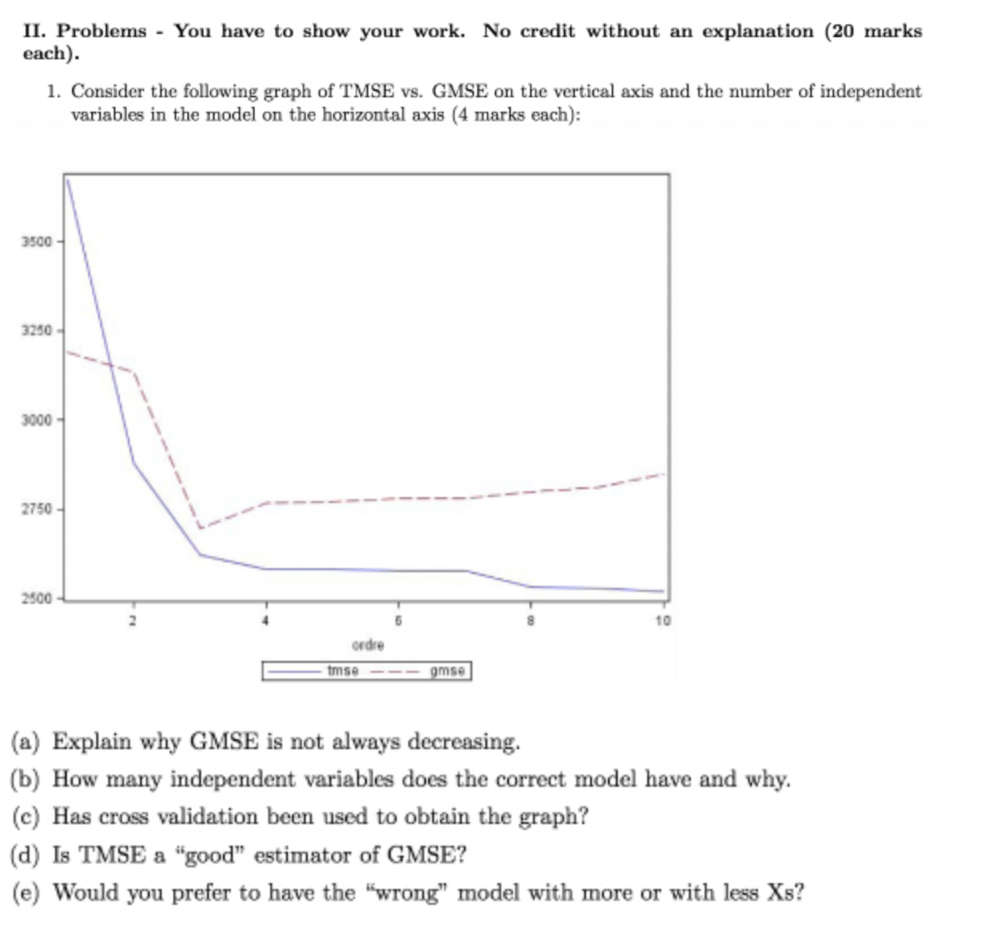
II. Problems - You have to show your work. No credit without an explanation (20 marks each). 1. Consider the following graph of TMSE vs. GMSE on the vertical axis and the number of independent variables in the model on the horizontal axis (4 marks each): 3500 - 3250 3000 2750- 2500 ordre tmse gmse (a) Explain why GMSE is not always decreasing. (b) How many independent variables does the correct model have and why. (c) Has cross validation been used to obtain the graph? (d) Is TMSE a "good" estimator of GMSE? (e) Would you prefer to have the "wrong" model with more or with less Xs
Step by Step Solution
There are 3 Steps involved in it
1 Expert Approved Answer
Step: 1 Unlock

Question Has Been Solved by an Expert!
Get step-by-step solutions from verified subject matter experts
Step: 2 Unlock
Step: 3 Unlock