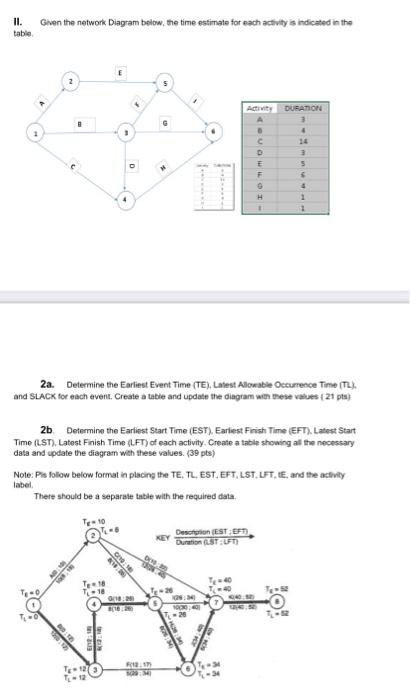
Question: II. table Given the network Diagram below, the time estimate for each activity is indicated in the DURATION G 6 c D E F 3

II. table Given the network Diagram below, the
II. table Given the network Diagram below, the time estimate for each activity is indicated in the DURATION G 6 c D E F 3 5 D H 1 1 2a. Determine the earliest Event Time (TE)Latest lowable Occurrence Time (TL) and SLACK for each event. Create a table and update the diagram with these values 21 pts 2b. Determine the Earliest Start Time (EST). Earliest Finish Time (EFT). Latest Start Time (LST). Latest Finish Time (LFT) of each activity. Create a table showing all the necessary data and update the diagram with these values. (39 pts) Note: Ps foliow below format in placing the TE, TL, EST. EFT, LST, LFT, LE, and the activity label There should be a separate table with the required data KEY Destion EST EFT GRO TED 10 sls T27

Step by Step Solution

There are 3 Steps involved in it

1 Expert Approved Answer
Step: 1 Unlock blur-text-image
Question Has Been Solved by an Expert!

Get step-by-step solutions from verified subject matter experts

Step: 2 Unlock
Step: 3 Unlock

Students Have Also Explored These Related General Management Questions!