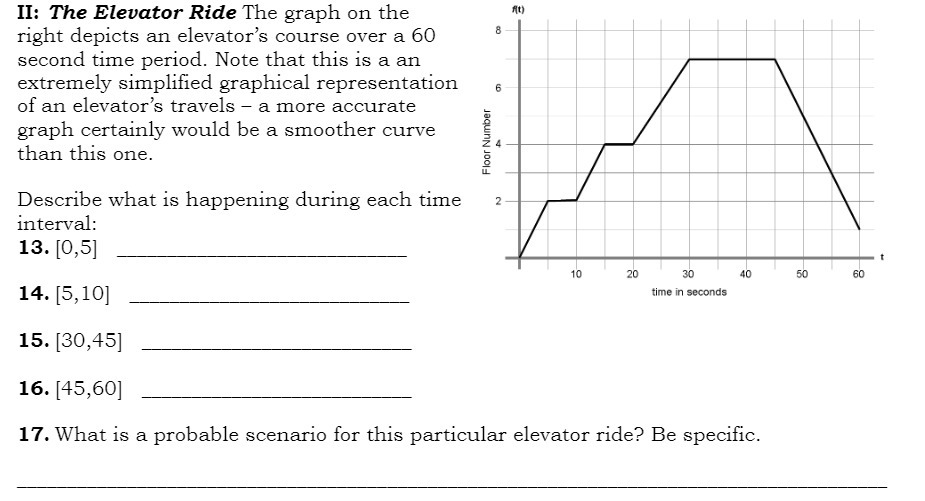
Question: II: The Elevator Ride The graph on the right depicts an elevator's course over a 60 second time period. Note that this is a an

II: The Elevator Ride The graph on the right
II: The Elevator Ride The graph on the right depicts an elevator's course over a 60 second time period. Note that this is a an extremely simplified graphical representation of an elevator's travels - a more accurate graph certainly would be a smoother curve Floor Number 4 than this one. Describe what is happening during each time 2 interval: 13. [0,5] 10 20 30 40 50 60 14. [5,10] time in seconds 15. [30,45] 16. [45,60] 17. What is a probable scenario for this particular elevator ride? Be specific

Step by Step Solution

There are 3 Steps involved in it

1 Expert Approved Answer
Step: 1 Unlock blur-text-image
Question Has Been Solved by an Expert!

Get step-by-step solutions from verified subject matter experts

Step: 2 Unlock
Step: 3 Unlock

Students Have Also Explored These Related Mathematics Questions!