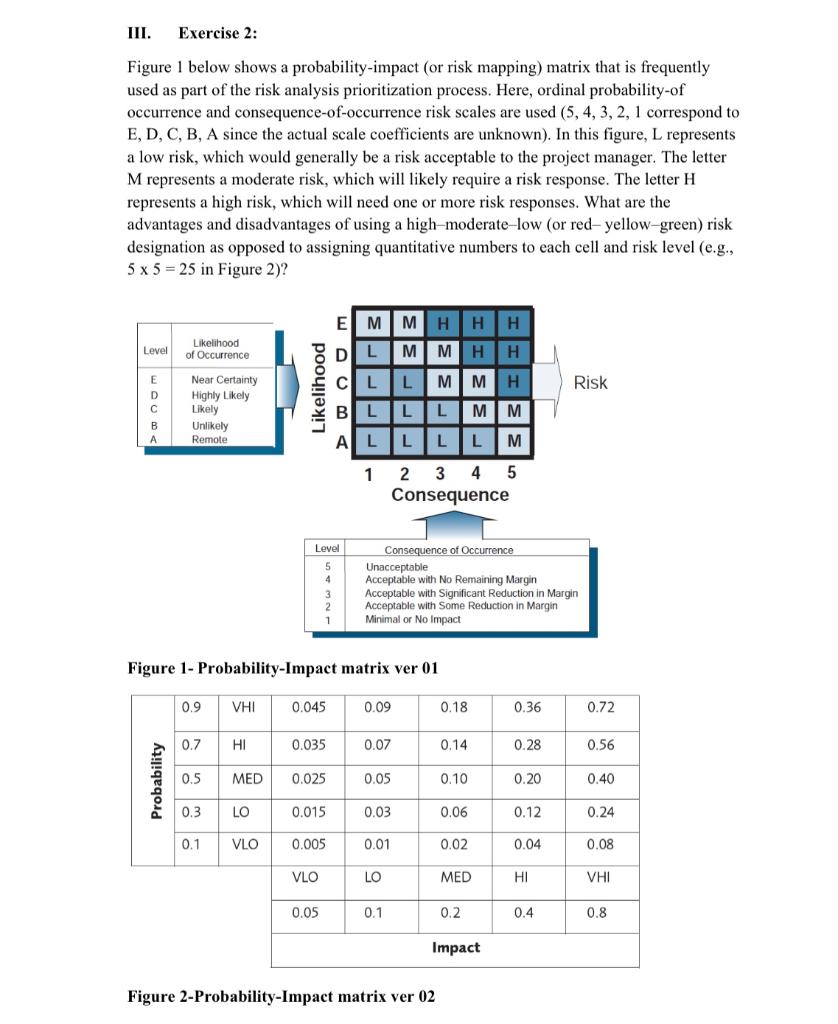
Question: III. Exercise 2: Figure 1 below shows a probability-impact (or risk mapping) matrix that is frequently used as part of the risk analysis prioritization process.

III. Exercise 2: Figure 1 below shows a

III. Exercise 2: Figure 1 below shows a probability-impact (or risk mapping) matrix that is frequently used as part of the risk analysis prioritization process. Here, ordinal probability-of occurrence and consequence-of-occurrence risk scales are used (5,4,3,2,1 correspond to E, D, C, B, A since the actual scale coefficients are unknown). In this figure, L represents a low risk, which would generally be a risk acceptable to the project manager. The letter M represents a moderate risk, which will likely require a risk response. The letter H represents a high risk, which will need one or more risk responses. What are the advantages and disadvantages of using a high-moderate-low (or red- yellow-green) risk designation as opposed to assigning quantitative numbers to each cell and risk level (e.g., 55=25 in Figure 2)? Figure 1- Probability-Impact matrix ver 01 Figure 2-Probability-Impact matrix ver 02

Step by Step Solution

There are 3 Steps involved in it

1 Expert Approved Answer
Step: 1 Unlock blur-text-image
Question Has Been Solved by an Expert!

Get step-by-step solutions from verified subject matter experts

Step: 2 Unlock
Step: 3 Unlock

Students Have Also Explored These Related General Management Questions!