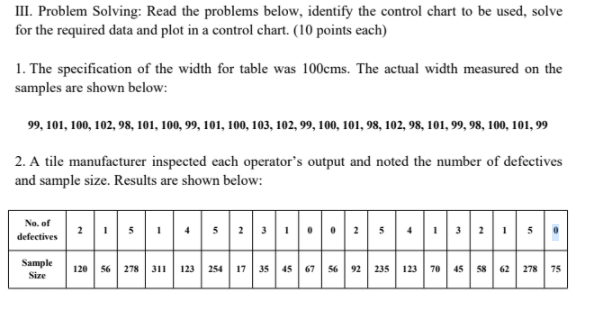
Question: III. Problem Solving: Read the problems below, identify the control chart to be used, solve for the required data and plot in a control chart.

III. Problem Solving: Read the problems below,

III. Problem Solving: Read the problems below, identify the control chart to be used, solve for the required data and plot in a control chart. (10 points each) 1. The specification of the width for table was 100cms. The actual width measured on the samples are shown below: 99, 101, 100, 102, 98, 101, 100, 99, 101, 100, 103, 102, 99, 100, 101, 98, 102, 98, 101, 99, 98, 100, 101,99 2. A tile manufacturer inspected each operator's output and noted the number of defectives and sample size. Results are shown below: No. of defectives 5 5 5 Sample Size 120 56 278 311 123 254 17 35 4567 5692 235 123 70 45 58 62 278 75

Step by Step Solution

There are 3 Steps involved in it

1 Expert Approved Answer
Step: 1 Unlock blur-text-image
Question Has Been Solved by an Expert!

Get step-by-step solutions from verified subject matter experts

Step: 2 Unlock
Step: 3 Unlock

Students Have Also Explored These Related General Management Questions!