

Question: III. PROCEDURE: 1. Given the data from in the table below, make a graph of the distance covered with time by a car moving along
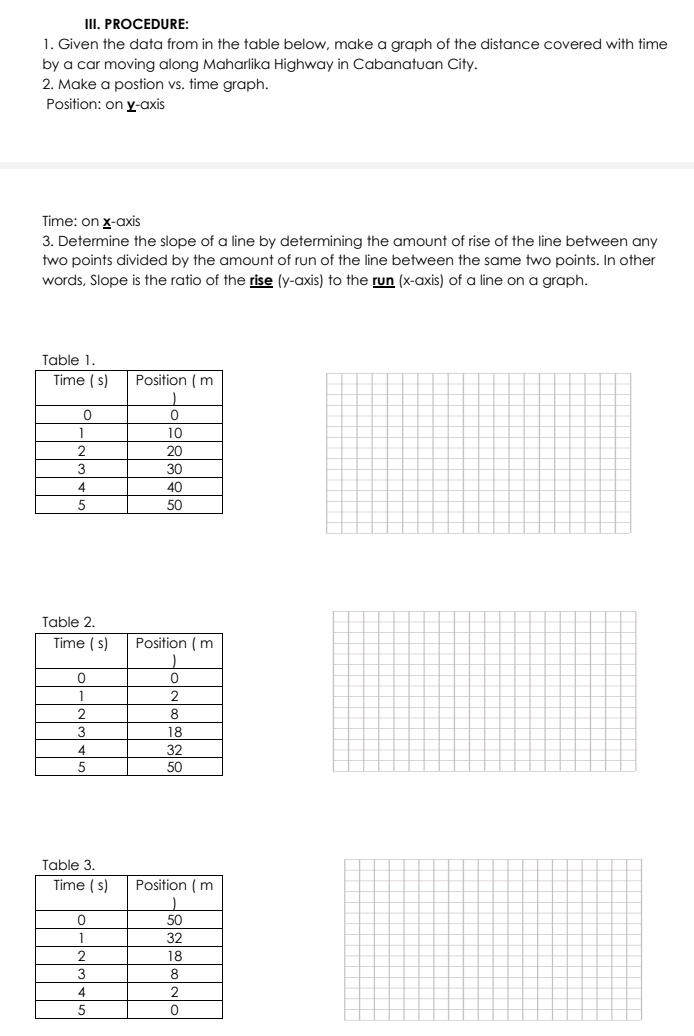
III. PROCEDURE: 1. Given the data from in the table below, make a graph of the distance covered with time by a car moving along Maharlika Highway in Cabanatuan City. 2. Make a postion vs. time graph. Position: on y-axis Time: on x-axis 3. Determine the slope of a line by determining the amount of rise of the line between any two points divided by the amount of run of the line between the same two points. In other words, Slope is the ratio of the rise (y-axis) to the run (x-axis) of a line on a graph. Table 1. Time ( s) Position ( m 0 0 10 20 LAWN - 30 40 50 Table 2. Time ( s) Position ( m 0 0 8 AW N - 18 32 50 Table 3. Time ( s) Position ( m 0 50 32 18 UAW N - 2 O
Step by Step Solution
There are 3 Steps involved in it

Get step-by-step solutions from verified subject matter experts