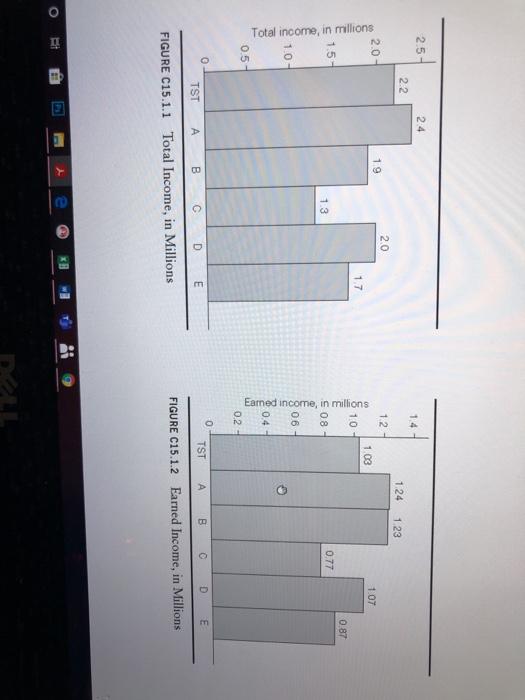
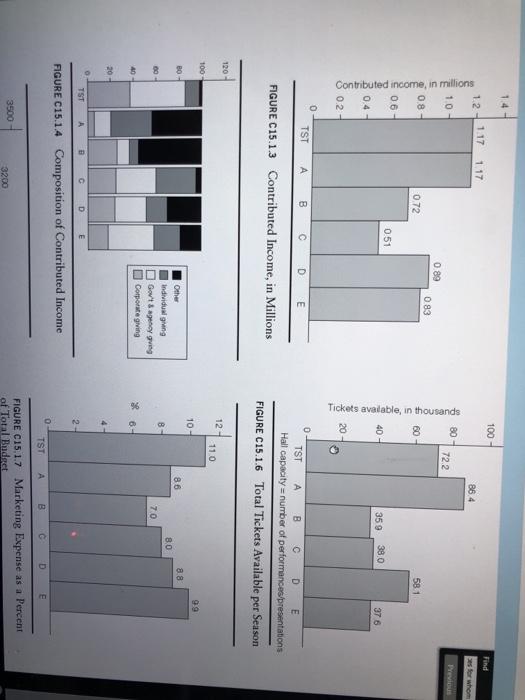
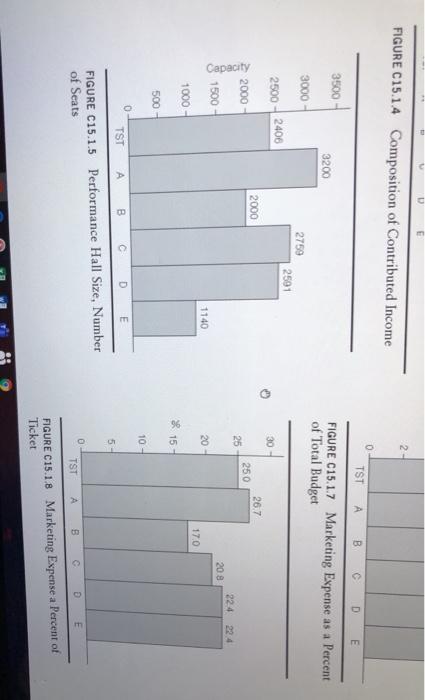
Question: il to Previous Q ASSIGNMENT Study Figures C15.1.1 through C15.1.8 and discuss how well the performing arts association is doing when com- pared with other

il to Previous Q ASSIGNMENT Study Figures C15.1.1
il to Previous Q ASSIGNMENT Study Figures C15.1.1 through C15.1.8 and discuss how well the performing arts association is doing when com- pared with other best-in-field associations. 2.5 2.4 14 2.2 124 1.23 20 1.2 2.0 - 19 103 1.07 1.7 10 0.87 1.5 - 1.3 S08- 0.77 Total income, in millions Earned income, in millions 06- 1.0 04 0.5- 0.2 = 0 0 TST B C D E TST B C D E FIGURE C15.1.2 Earned Income, in Millions FIGURE C15.1.1 Total Income, in Millions e 14 100- Tind 12 - 1.17 1.17 86.4 for whom 10 - 80 722 0 89 08- 0.83 0.72 60- 58.1 Contributed income, in millions 06- Tickets available in thousands 0.51 40 359 38.0 37 6 0.4 0.2 - 20 O TST A B C DE 0 TST B C D E Hall capacity = number of performances presentations FIGURE C15.1.3 Contributed Income, in Millions FIGURE C15.1.6 Total Tickets Available per Season 120 12 110 100 99 10- B0 86 8.8 8.0 Other Individual ging Gov't agency in Corporate giving B 00 70 40 20 TST AC DE 2 FIGURE C15.1.4 Composition of Contributed Income TST A B C D E 3500 FIGURE C15.1.7 Marketing Expense as a Percent of Total Budset 3200 2- FIGURE C15.1.4 Composition of Contributed Income 0 3500 TST A B C D E FIGURE C15.1.7 Marketing Expense as a Percent of Total Budget 3200 3000 - 2759 2501 2500 2406 30 2000 26.7 2000- 250 25 Capacity 224 224 1500- 20 8 1140 20- 17.0 1000- * 15 500 10 - 5- 0 TST C D E FIGURE C15.1.5 Performance Hall Size, Number of Seats TST AB DE FIGURE C15.1.8 Marketing Expense a Percent of Ticket il to Previous Q ASSIGNMENT Study Figures C15.1.1 through C15.1.8 and discuss how well the performing arts association is doing when com- pared with other best-in-field associations. 2.5 2.4 14 2.2 124 1.23 20 1.2 2.0 - 19 103 1.07 1.7 10 0.87 1.5 - 1.3 S08- 0.77 Total income, in millions Earned income, in millions 06- 1.0 04 0.5- 0.2 = 0 0 TST B C D E TST B C D E FIGURE C15.1.2 Earned Income, in Millions FIGURE C15.1.1 Total Income, in Millions e 14 100- Tind 12 - 1.17 1.17 86.4 for whom 10 - 80 722 0 89 08- 0.83 0.72 60- 58.1 Contributed income, in millions 06- Tickets available in thousands 0.51 40 359 38.0 37 6 0.4 0.2 - 20 O TST A B C DE 0 TST B C D E Hall capacity = number of performances presentations FIGURE C15.1.3 Contributed Income, in Millions FIGURE C15.1.6 Total Tickets Available per Season 120 12 110 100 99 10- B0 86 8.8 8.0 Other Individual ging Gov't agency in Corporate giving B 00 70 40 20 TST AC DE 2 FIGURE C15.1.4 Composition of Contributed Income TST A B C D E 3500 FIGURE C15.1.7 Marketing Expense as a Percent of Total Budset 3200 2- FIGURE C15.1.4 Composition of Contributed Income 0 3500 TST A B C D E FIGURE C15.1.7 Marketing Expense as a Percent of Total Budget 3200 3000 - 2759 2501 2500 2406 30 2000 26.7 2000- 250 25 Capacity 224 224 1500- 20 8 1140 20- 17.0 1000- * 15 500 10 - 5- 0 TST C D E FIGURE C15.1.5 Performance Hall Size, Number of Seats TST AB DE FIGURE C15.1.8 Marketing Expense a Percent of Ticket

Step by Step Solution

There are 3 Steps involved in it

1 Expert Approved Answer
Step: 1 Unlock blur-text-image
Question Has Been Solved by an Expert!

Get step-by-step solutions from verified subject matter experts

Step: 2 Unlock
Step: 3 Unlock

Students Have Also Explored These Related General Management Questions!