

Question: Im asking for the graph with the graph that is on top = IH ANALYZING RESTRICTION DIGEST RESULTS Task #1- Measuring distance bands traveled on
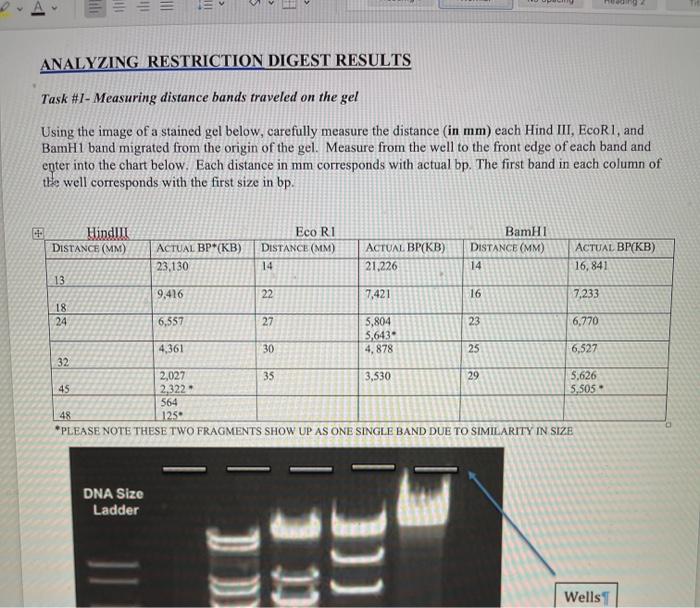
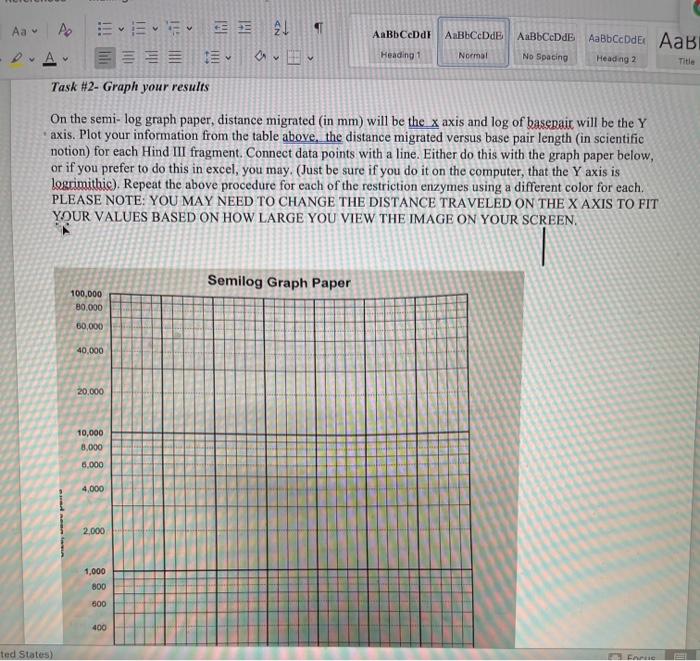
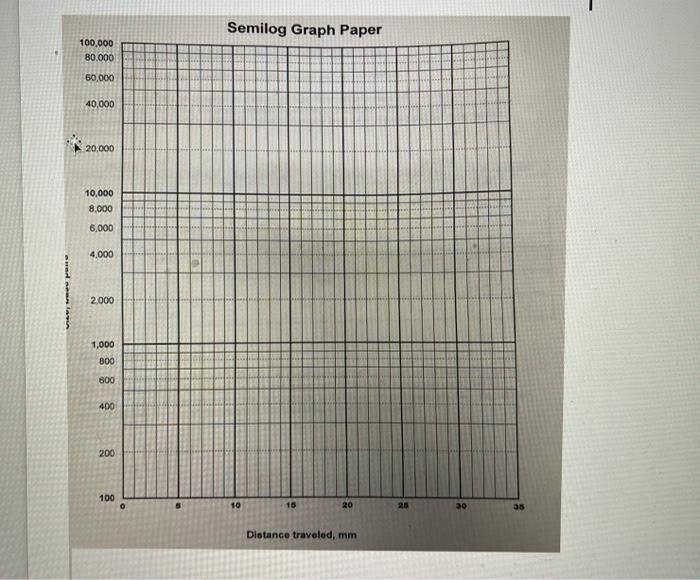
= IH ANALYZING RESTRICTION DIGEST RESULTS Task #1- Measuring distance bands traveled on the gel Using the image of a stained gel below, carefully measure the distance (in mm) each Hind III, EcoR1, and BamH1 band migrated from the origin of the gel. Measure from the well to the front edge of each band and enter into the chart below. Each distance in mm corresponds with actual bp. The first band in each column of the well corresponds with the first size in bp. Hindili Eco RI BamHI DISTANCE (MM) ACTUAL BP*(KB) DISTANCE (MM) ACTUAL BP(KB) DISTANCE (MM) ACTUAL BP(KB) 23,130 14 21.226 14 16,841 13 9,416 22 7,421 16 7,233 18 24 6,557 27 5,804 23 6,770 5,643 4,361 30 4,878 25 6,527 32 2,027 35 3,530 29 5,626 45 2,322 5,505 564 48 125 *PLEASE NOTE THESE TWO FRAGMENTS SHOW UP AS ONE SINGLE BAND DUE TO SIMILARITY IN SIZE DNA Size Ladder ) Wells Aa A AaBb CcDdi y Ever = =! AaBbCcDE AaBbCcDdE AaBbccdet AaB D A Heading 1 Normal No Spacing Heading 2 Title Task #2- Graph your results On the semi-log graph paper, distance migrated (in mm) will be the x axis and log of basepair will be the Y axis. Plot your information from the table above, the distance migrated versus base pair length (in scientific notion) for each Hind III fragment. Connect data points with a line. Either do this with the graph paper below, or if you prefer to do this in excel, you may. (Just be sure if you do it on the computer, that the Y axis is logrimithic). Repeat the above procedure for each of the restriction enzymes using a different color for each. PLEASE NOTE: YOU MAY NEED TO CHANGE THE DISTANCE TRAVELED ON THE X AXIS TO FIT YOUR VALUES BASED ON HOW LARGE YOU VIEW THE IMAGE ON YOUR SCREEN. Semilog Graph Paper 100,000 80.000 60,000 40,000 20.000 10,000 8,000 6.000 4,000 www. 2.000 1,000 800 600 400 ted States) Semilog Graph Paper 100,000 80.000 60,000 40,000 20.000 10,000 8,000 6.000 4,000 2,000 1,000 800 600 400 200 100 o 10 16 20 20 30 as Distance traveled, mm = IH ANALYZING RESTRICTION DIGEST RESULTS Task #1- Measuring distance bands traveled on the gel Using the image of a stained gel below, carefully measure the distance (in mm) each Hind III, EcoR1, and BamH1 band migrated from the origin of the gel. Measure from the well to the front edge of each band and enter into the chart below. Each distance in mm corresponds with actual bp. The first band in each column of the well corresponds with the first size in bp. Hindili Eco RI BamHI DISTANCE (MM) ACTUAL BP*(KB) DISTANCE (MM) ACTUAL BP(KB) DISTANCE (MM) ACTUAL BP(KB) 23,130 14 21.226 14 16,841 13 9,416 22 7,421 16 7,233 18 24 6,557 27 5,804 23 6,770 5,643 4,361 30 4,878 25 6,527 32 2,027 35 3,530 29 5,626 45 2,322 5,505 564 48 125 *PLEASE NOTE THESE TWO FRAGMENTS SHOW UP AS ONE SINGLE BAND DUE TO SIMILARITY IN SIZE DNA Size Ladder ) Wells Aa A AaBb CcDdi y Ever = =! AaBbCcDE AaBbCcDdE AaBbccdet AaB D A Heading 1 Normal No Spacing Heading 2 Title Task #2- Graph your results On the semi-log graph paper, distance migrated (in mm) will be the x axis and log of basepair will be the Y axis. Plot your information from the table above, the distance migrated versus base pair length (in scientific notion) for each Hind III fragment. Connect data points with a line. Either do this with the graph paper below, or if you prefer to do this in excel, you may. (Just be sure if you do it on the computer, that the Y axis is logrimithic). Repeat the above procedure for each of the restriction enzymes using a different color for each. PLEASE NOTE: YOU MAY NEED TO CHANGE THE DISTANCE TRAVELED ON THE X AXIS TO FIT YOUR VALUES BASED ON HOW LARGE YOU VIEW THE IMAGE ON YOUR SCREEN. Semilog Graph Paper 100,000 80.000 60,000 40,000 20.000 10,000 8,000 6.000 4,000 www. 2.000 1,000 800 600 400 ted States) Semilog Graph Paper 100,000 80.000 60,000 40,000 20.000 10,000 8,000 6.000 4,000 2,000 1,000 800 600 400 200 100 o 10 16 20 20 30 as Distance traveled, mm
Step by Step Solution
There are 3 Steps involved in it

Get step-by-step solutions from verified subject matter experts