

Question: I'm getting stuck on C and D Can you explain how I find which demand values belong to both questions C and D? I can't
I'm getting stuck on C and D Can you explain how I find which demand values belong to both questions C and D? I can't find the right x value for C, and I think my z value should be positive. I'm not sure what I'm doing wrong in my equations; I highlighted the formulas I used next to the answers. Can you explain how I can get the right answer?
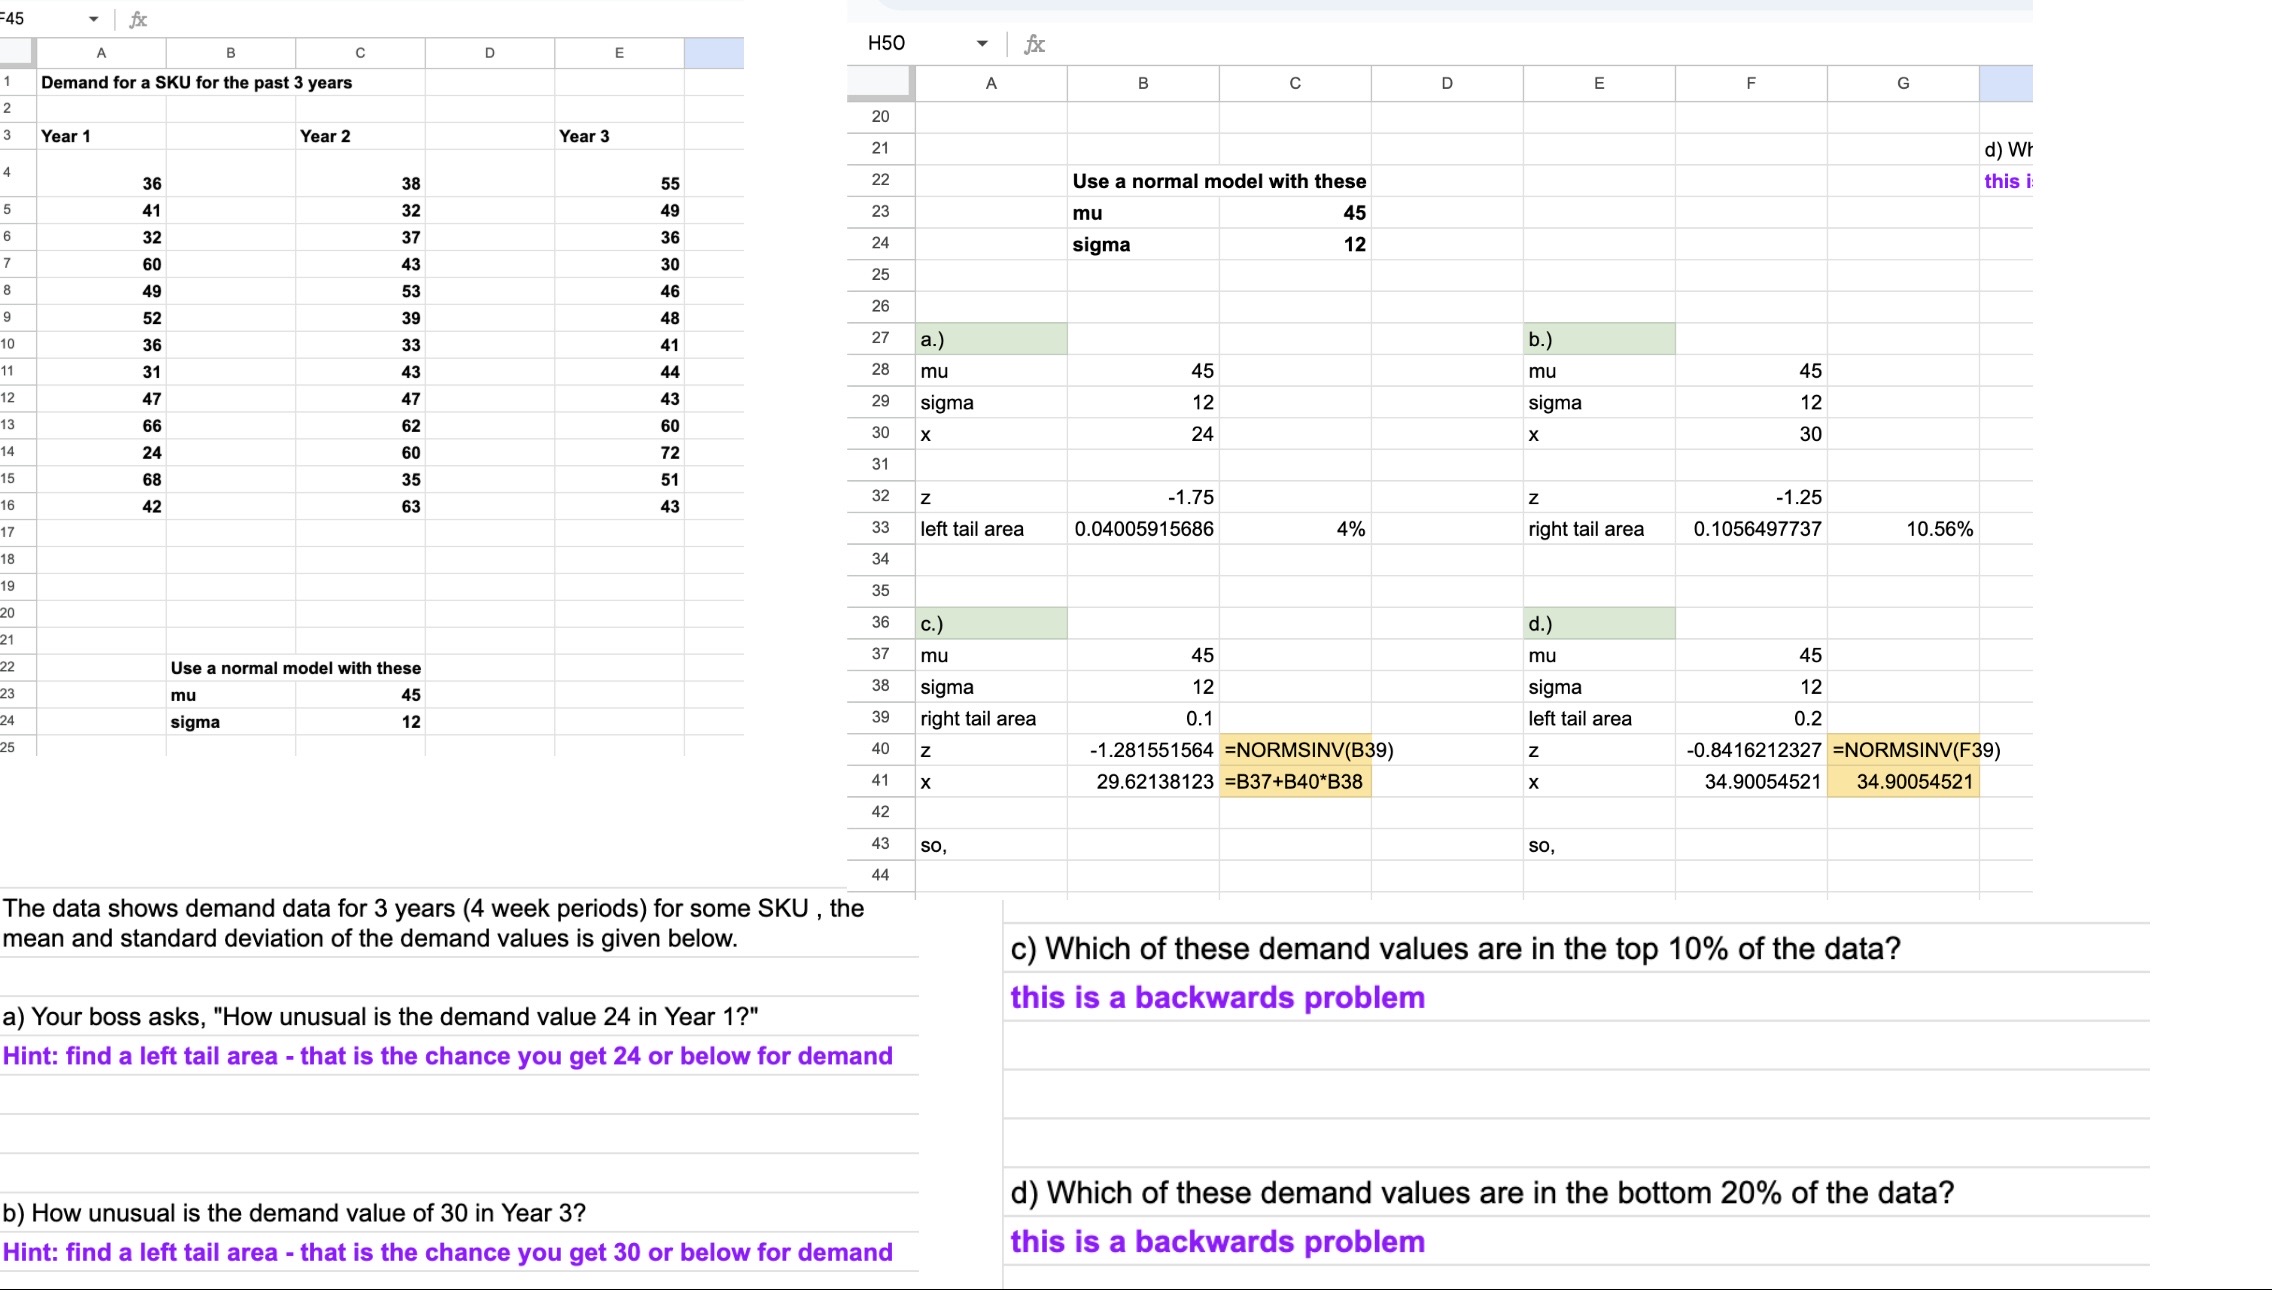
=45 - H50 v jk A B C D E l Demand for a SKU for the past 3 years A B C D E F G 2 20 3 Year 1 Year 2 Year 3 21 d) Wt 4 36 38 55 22 Use a normal model with these this i 5 41 32 49 23 mu 45 6 32 37 36 24 sigma 12 7 60 43 30 25 a 49 53 46 s 51 as An 26 m as 3: 41 27 a l b l H 31 4: M 28 mu 45 mu 45 '2 47 47 43 29 sigma 12 sigma 12 '3 6' 62 5\" 30 x 24 x 30 14 24 so 11 31 15 68 35 51 '5 42 63 43 32 Z -1.75 Z -1.25 17 33 left tail area 004005915686 4% right tail area 0.1056497737 10t56% 18 34 IS 35 zu 36 c.) d-) 2' 22 Use a normal model with these 37 m\" 45 m\" 45 23 m\" 45 38 sigma 12 sigma 12 24 sigma 12 39 right tail area 0.1 left tail area 0.2 25 40 z -1 201551564 =NORMS|NV(339) z -0.8416212327 =NORMS|NV(F39) 41 X 29.62138123 =B37+B40"B38 x 34.90054521 34.90054521 42 43 so, so, 44 The data shows demand data for 3 years (4 week periods) for some SKU , the mean and standard deVIation of the demand values is given below. 6) Which of these demand values are in the top 10% Of the data? a) Your boss asks, "How unusual is the demand value 24 in Year 1?" thls IS a baCKwa'ds PrOblem Hint: find a left tail area - that is the chance you get 24 or below for demand d) Which of these demand values are in the bottom 20% of the data? b) How unusual is the demand value of 30 in Year 3? this is a backwards problem Hint: find a left tail area - that is the chance you get 30 or below for demand
Step by Step Solution
There are 3 Steps involved in it

Get step-by-step solutions from verified subject matter experts