

Question: I'm going to attach data for part 1 and part 2 below A. Use the describe command to report 1) the number of observations and
I'm going to attach data for part 1 and part 2 below
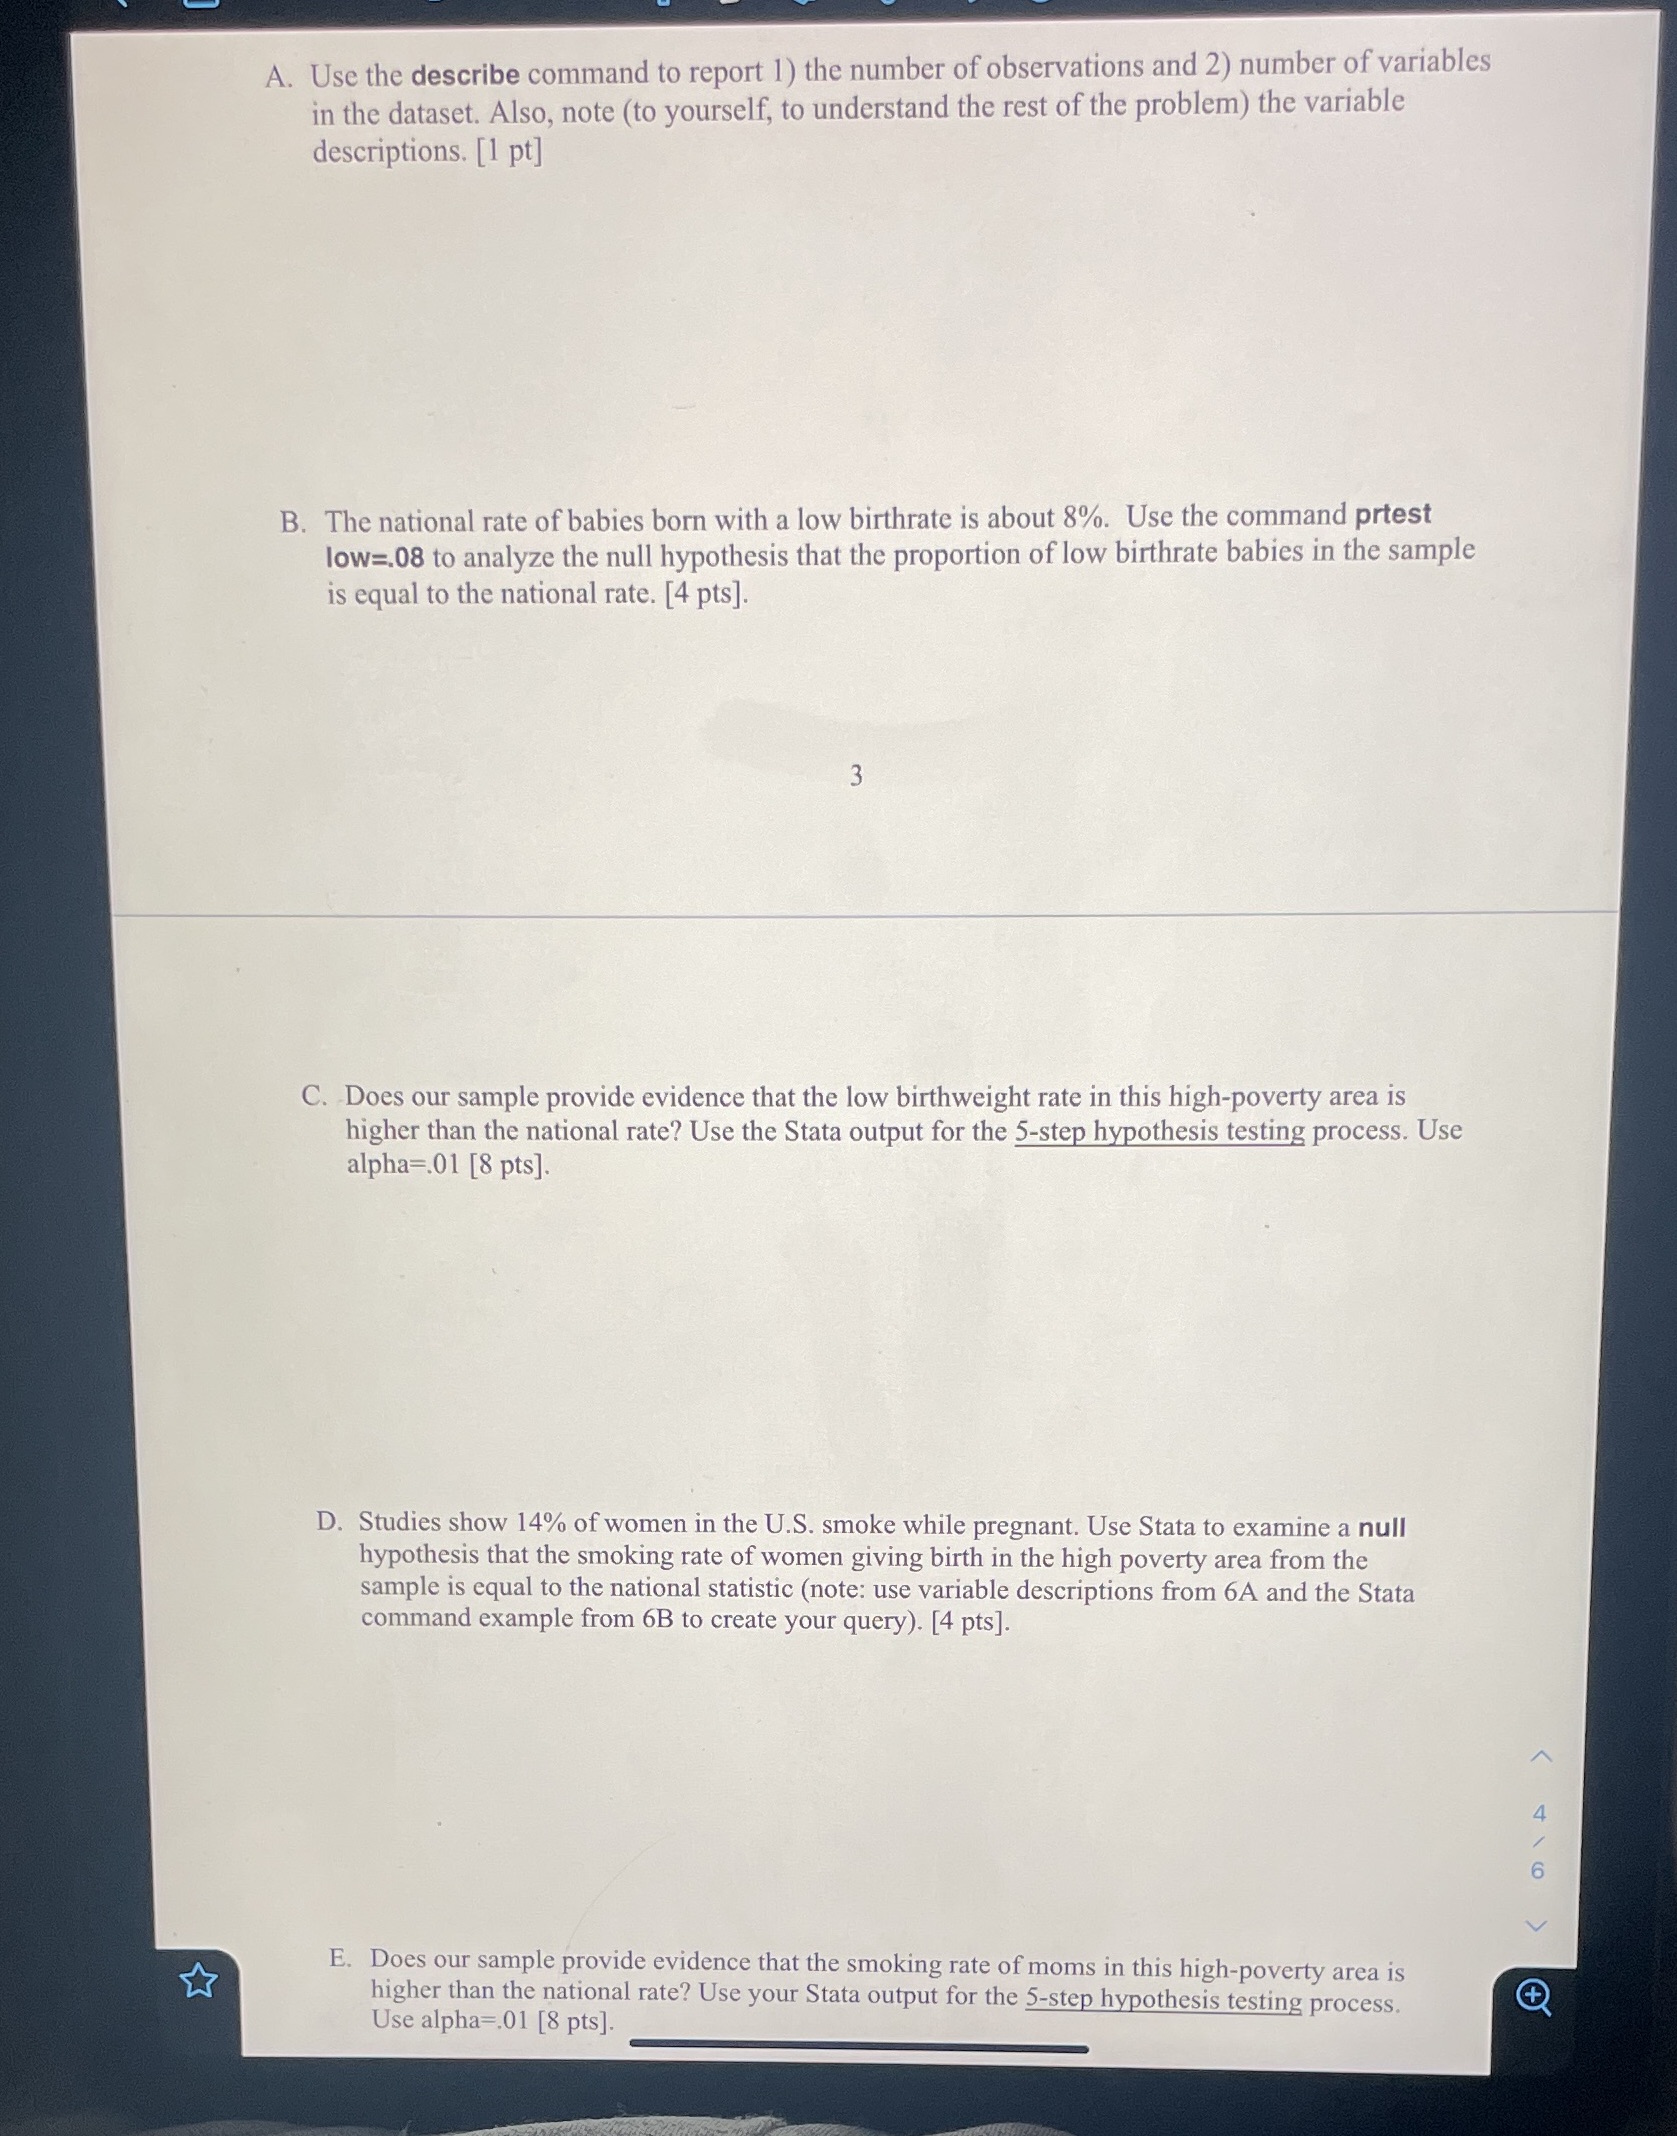
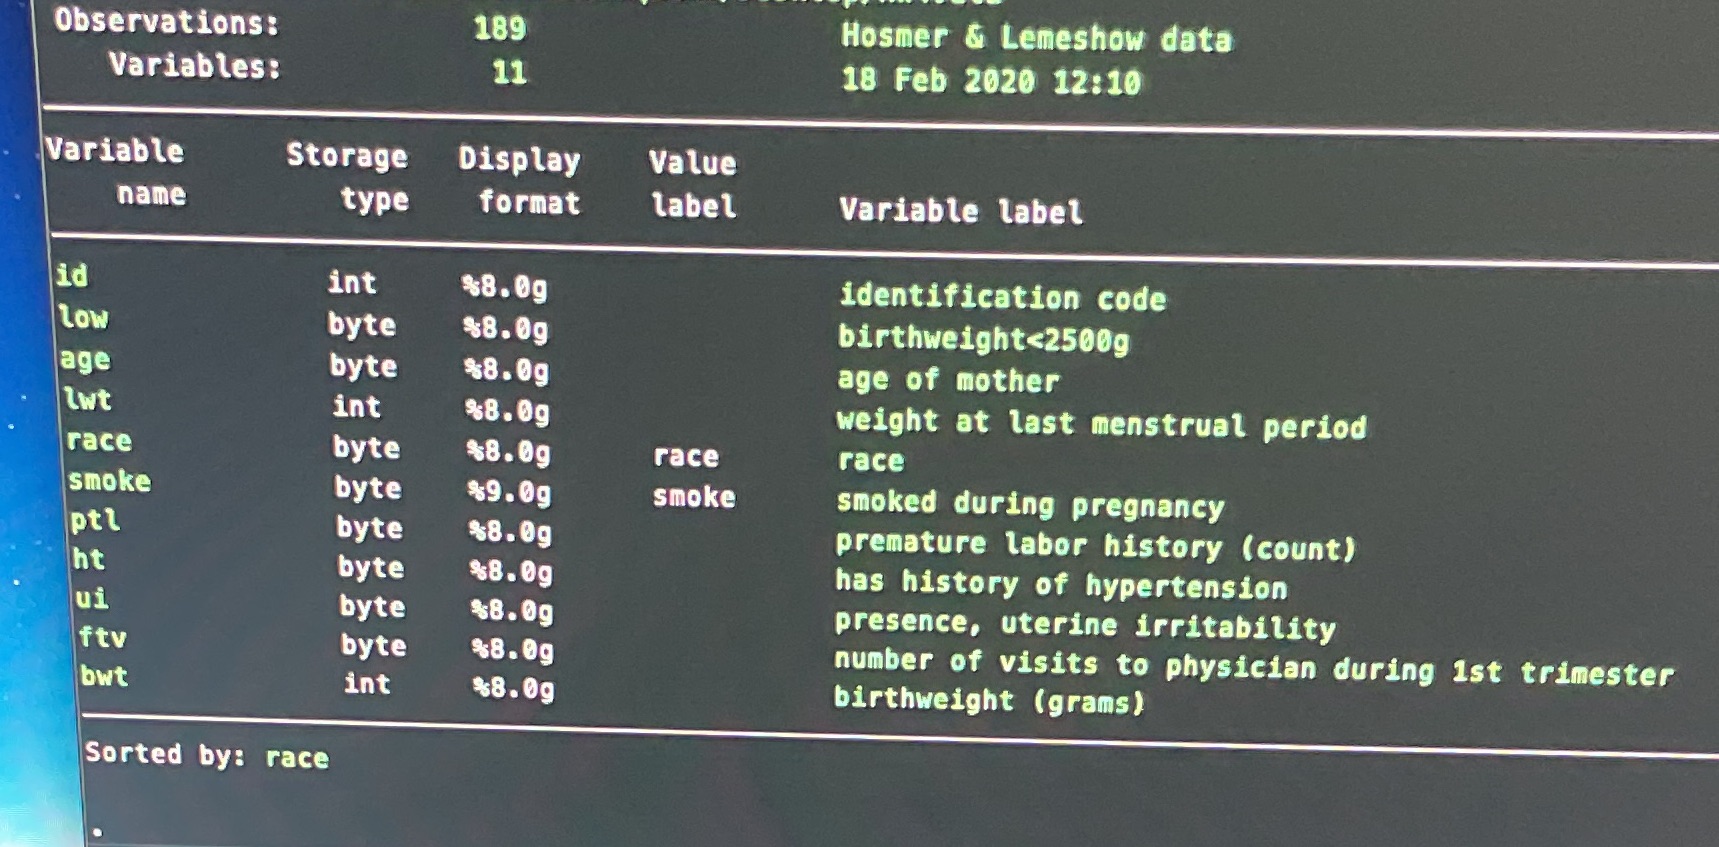
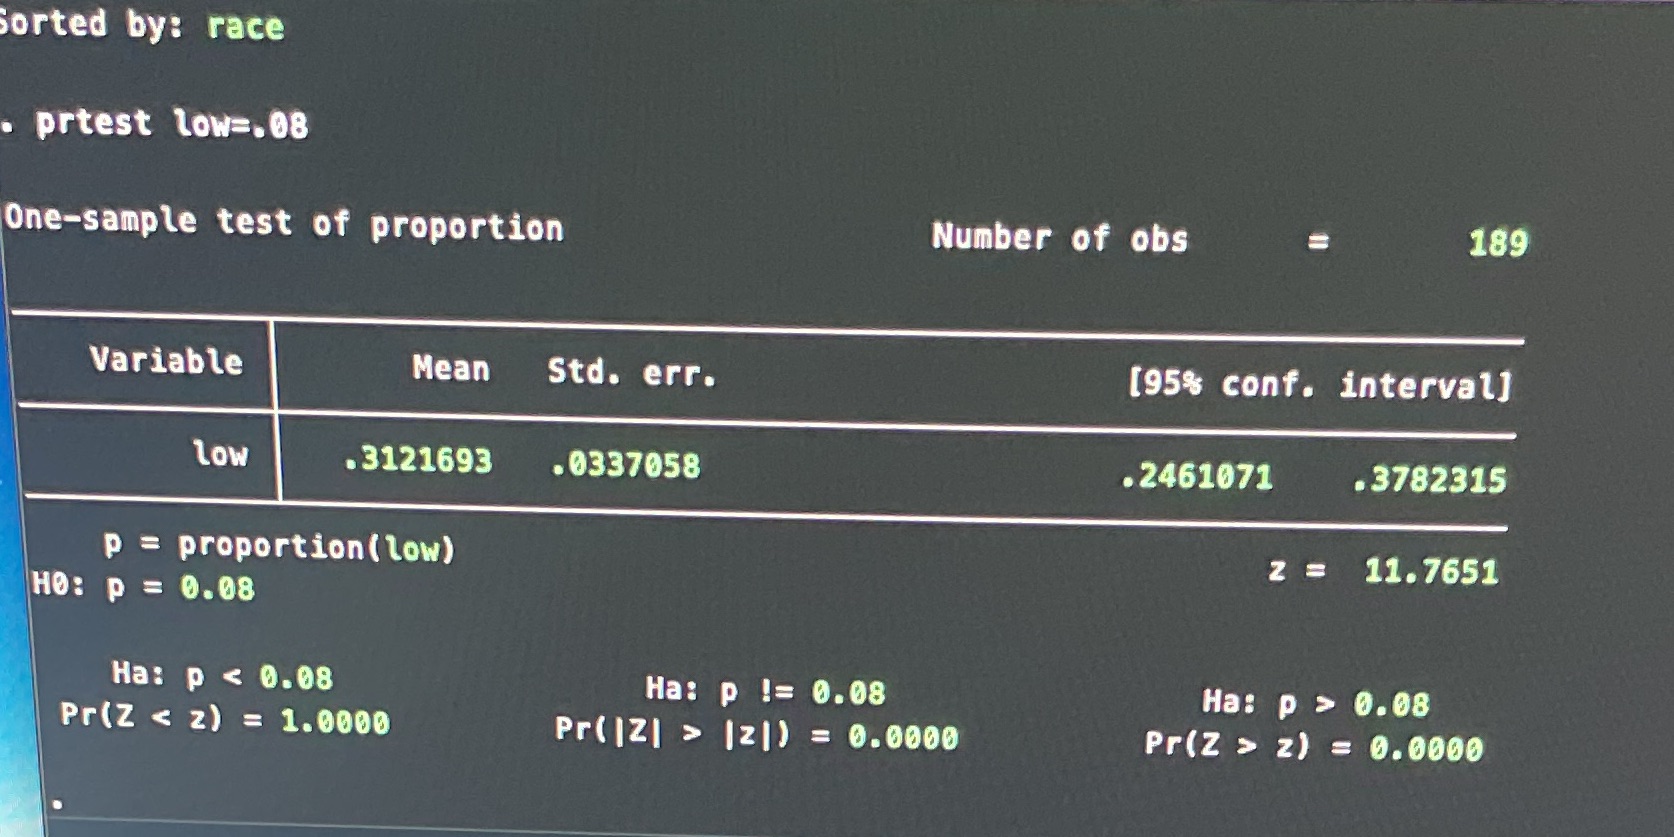
A. Use the describe command to report 1) the number of observations and 2) number of variables in the dataset. Also, note (to yourself, to understand the rest of the problem) the variable descriptions. [1 pt] B. The national rate of babies born with a low birthrate is about 8%. Use the command prtest low=.08 to analyze the null hypothesis that the proportion of low birthrate babies in the sample is equal to the national rate. [4 pts]. C. Does our sample provide evidence that the low birthweight rate in this high-poverty area is higher than the national rate? Use the Stata output for the 5-step hypothesis testing process. Use alpha=.01 [8 pts]. D. Studies show 14% of women in the U.S. smoke while pregnant. Use Stata to examine a null hypothesis that the smoking rate of women giving birth in the high poverty area from the sample is equal to the national statistic (note: use variable descriptions from 6A and the Stata command example from 6B to create your query). [4 pts]. V E. Does our sample provide evidence that the smoking rate of moms in this high-poverty area is higher than the national rate? Use your Stata output for the 5-step hypothesis testing process. Use alpha=.01 [8 pts].Observations : 189 Hosmer & Lemeshow data Variables: 11 18 Feb 2020 12:10 Variable Storage Display Value name type format label Variable label id int $8.0g identification code low byte $8.0g birthweight 0.08 Pr(Z |21) = 0.0000 Pr(Z > Z) = 0.0000
Step by Step Solution
There are 3 Steps involved in it

Get step-by-step solutions from verified subject matter experts