

Question: I'm having a hard time computing p-values using the standard normal distribution chart. For my exam, that is the only method I'm allowed to use.
I'm having a hard time computing p-values using the standard normal distribution chart. For my exam, that is the only method I'm allowed to use. I can't use Excel or online calculator.
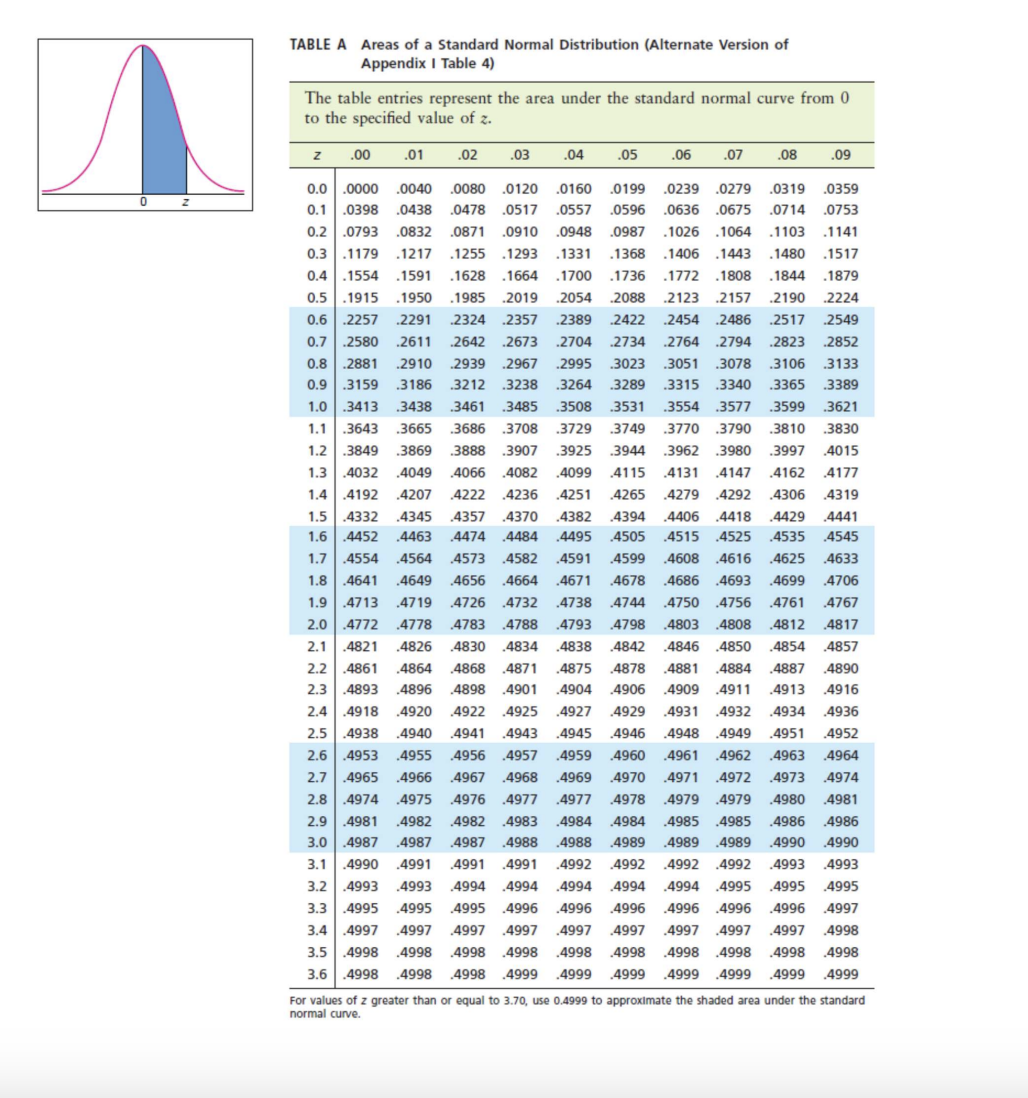
In another Chegg solution I received, the Expert Answer told me this: For 1.66, in the standard normal distribution table, look at the row labeled 1.6, and find the column labeled 0.06. The place where these meet shows you the probability value. If you look up z = 1.66 in a standard normal distribution table, you find that the corresponding area is approximately 0.9515. I have no idea where they got the .9515 from. When I look at this chart, I get .4515. There aren't even values that start with .9.
I feel like I'm missing something and I don't know what it is. Please help!!
TABLE A Areas of a Standard Normal Distribution (Alternate Version of Appendix I Table 4)
Step by Step Solution
There are 3 Steps involved in it

Get step-by-step solutions from verified subject matter experts