

Question: Im having a hard time with these box plots and how to interpret them. Is the line in the box showing men work over 40
Im having a hard time with these box plots and how to interpret them. Is the line in the box showing men work over 40 hours compared to women.
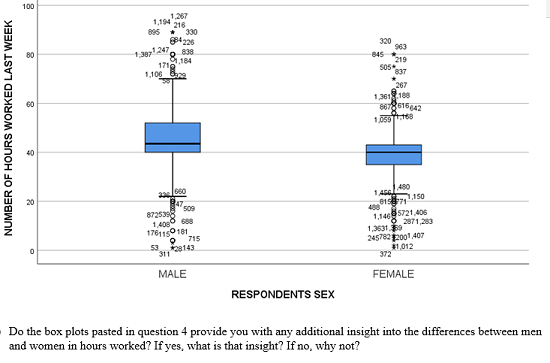
100 NUMBER OF HOURS WORKED LAST WEEK 1.267 1.104 216 3:30 1,3871247 838 563 21,184 845 1719 219 1.106 605# 837 267 887616842 1.059 40 1 450 20 6154771 1,150 1 148 5721.405 1761 159181 1,3631 350 6 271,243 715 245783 2001 407 53 31 1 #23143 372 $1,012 MALE FEMALE RESPONDENTS SEX Do the box plots pasted in question 4 provide you with any additional insight into the differences between men and women in hours worked? If yes, what is that insight? If no, why not
Step by Step Solution
There are 3 Steps involved in it
1 Expert Approved Answer
Step: 1 Unlock

Question Has Been Solved by an Expert!
Get step-by-step solutions from verified subject matter experts
Step: 2 Unlock
Step: 3 Unlock