

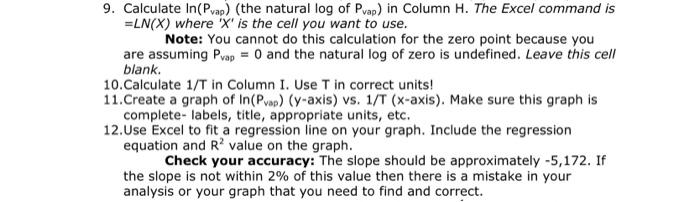
Question: i'm having trouble creating a graph In Excel P vap Vs 1/T. .... please help Create a graph of ln(Pvap) (y-axis) vs. 1/T (x-axis). Make
i'm having trouble creating a graph In Excel
P vap Vs 1/T..... please help
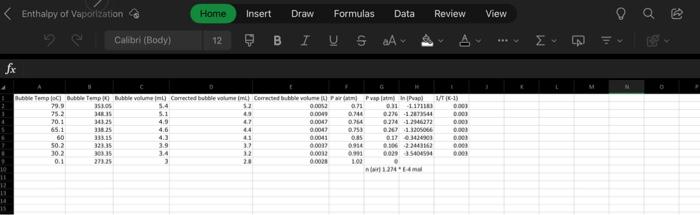
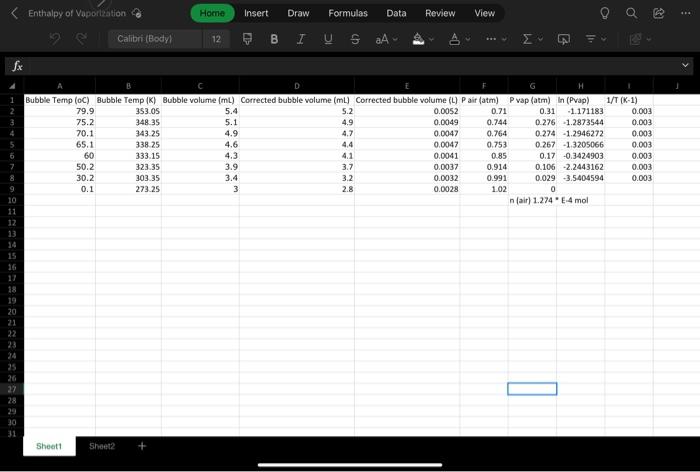
Create a graph of ln(Pvap) (y-axis) vs. 1/T (x-axis). Make sure this graph is complete- labels, title, appropriate units, etc.
Use Excel to fit a regression line on your graph. Include the regression equation and R2 value on the graph.
Check your accuracy: The slope should be approximately -5,172. If
the slope is not within 2% of this value then there is a mistake in your analysis or your graph that you need to find and correct.
Step by Step Solution
There are 3 Steps involved in it
1 Expert Approved Answer
Step: 1 Unlock

Question Has Been Solved by an Expert!
Get step-by-step solutions from verified subject matter experts
Step: 2 Unlock
Step: 3 Unlock