

Question: I'm having trouble creating the R script for the model and plot. Graph the training and testing error against the number of trees using a
I'm having trouble creating the R script for the model and plot.
Graph the training and testing error against the number of trees using a classification random forest model for the presence of heart disease (target) using variables age (age), sex (sex), chest pain type (cp), resting blood pressure (trestbps), cholesterol measurement (chol), resting electrocardiographic measurement (restecg), exercise-induced angina (exang), slope of peak exercise (slope), and number of major vessels (ca). Use a maximum of 200 trees. Use set.seed(511038).
So far I have this
#forest regression model set.seed(511038)
model1
model1
Expected plot
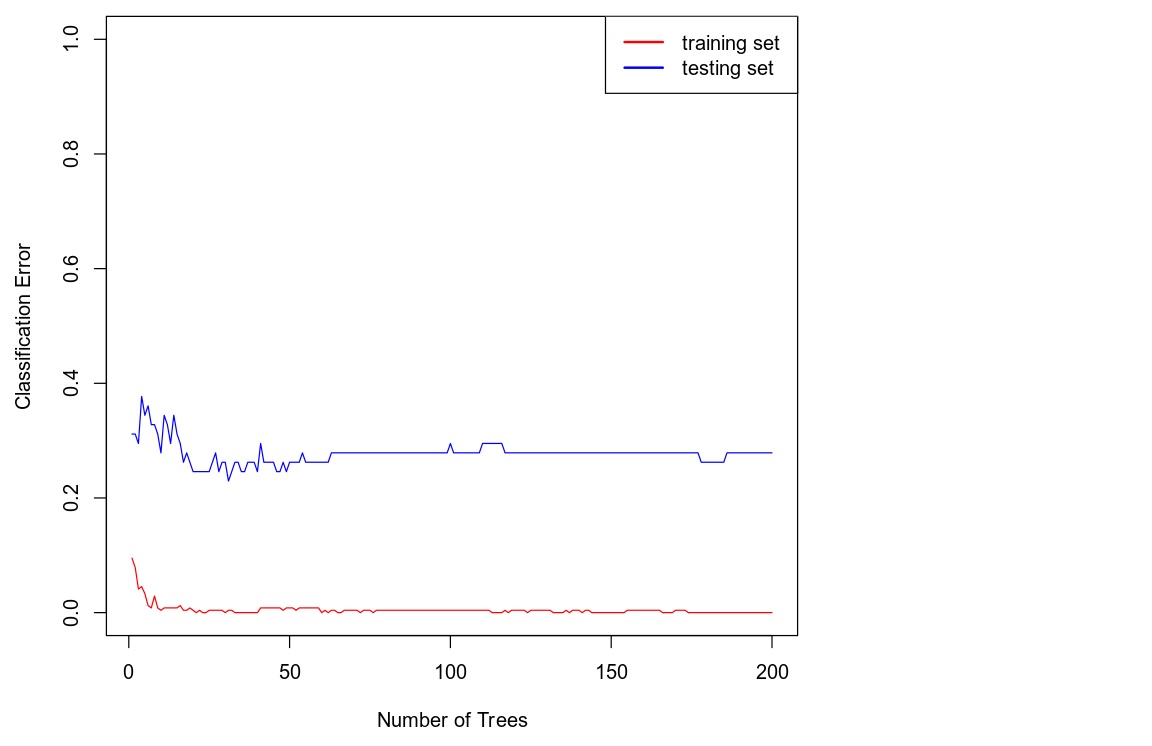
.0 training set testing set 0.8 Classification Error 0.2 0.0 0 50 100 150 200 Number of Trees
Step by Step Solution
There are 3 Steps involved in it

Get step-by-step solutions from verified subject matter experts