

Question: I'm having trouble solving these questions. Does anyone know the answer. The table shows the marginal cost for a company's product at various production levels.


I'm having trouble solving these questions. Does anyone know the answer.

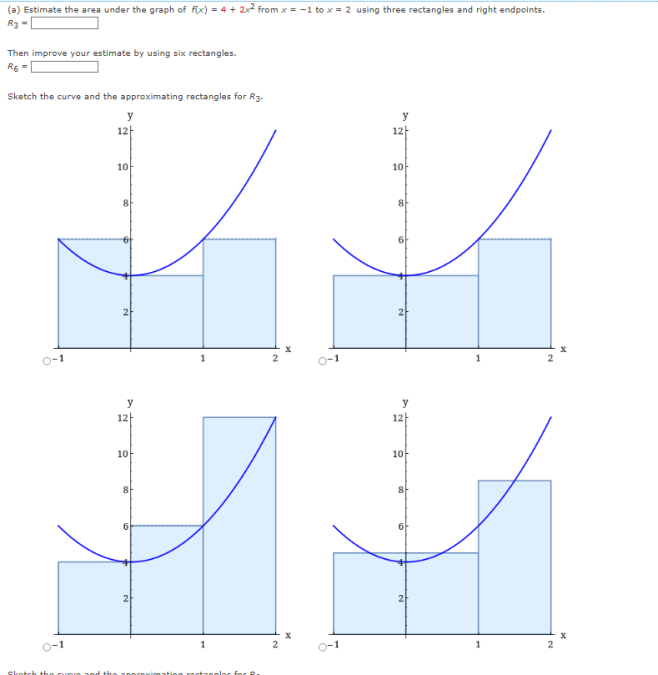

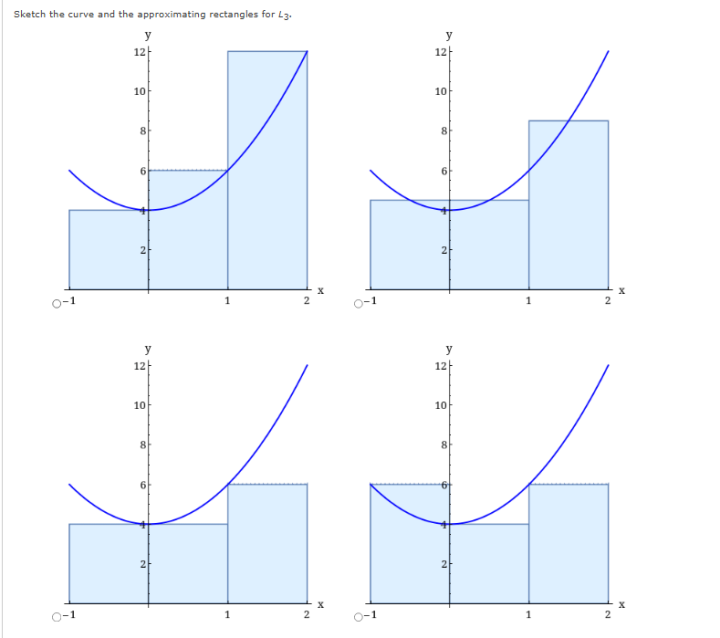
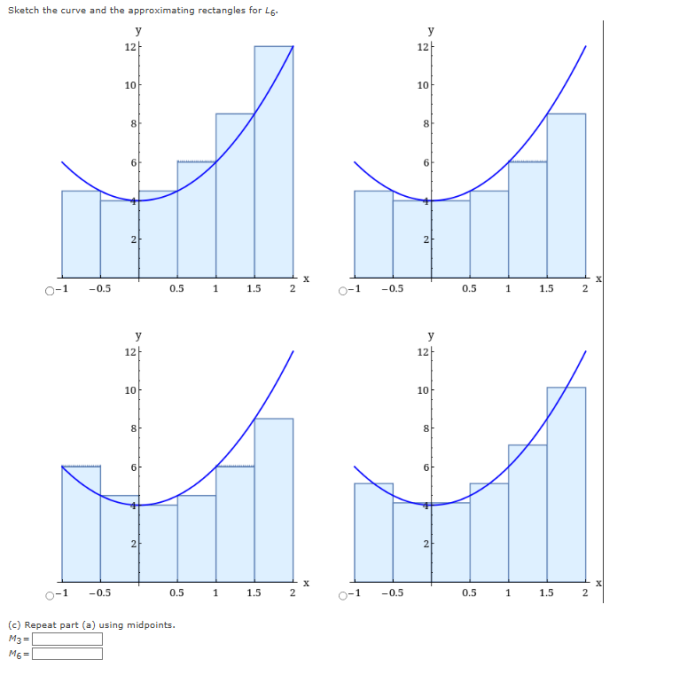


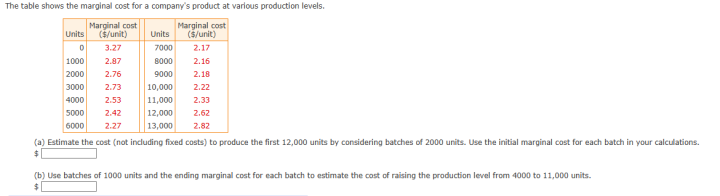
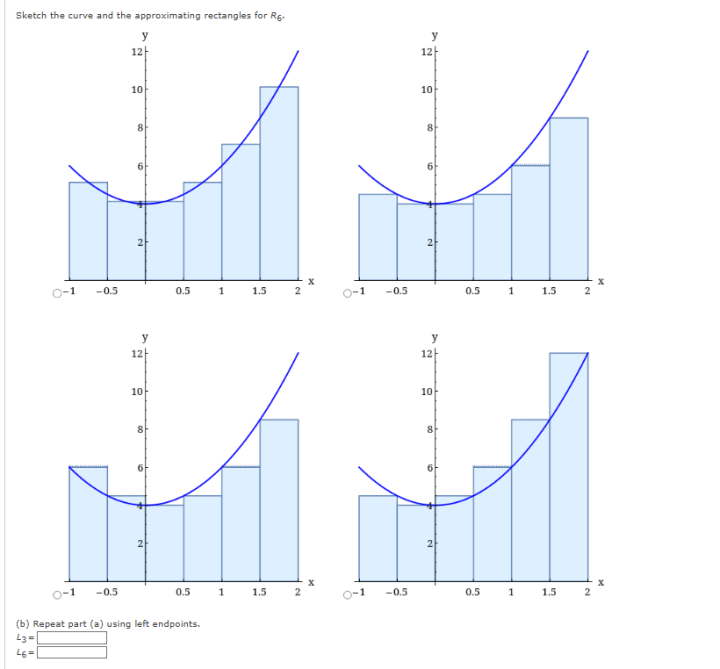
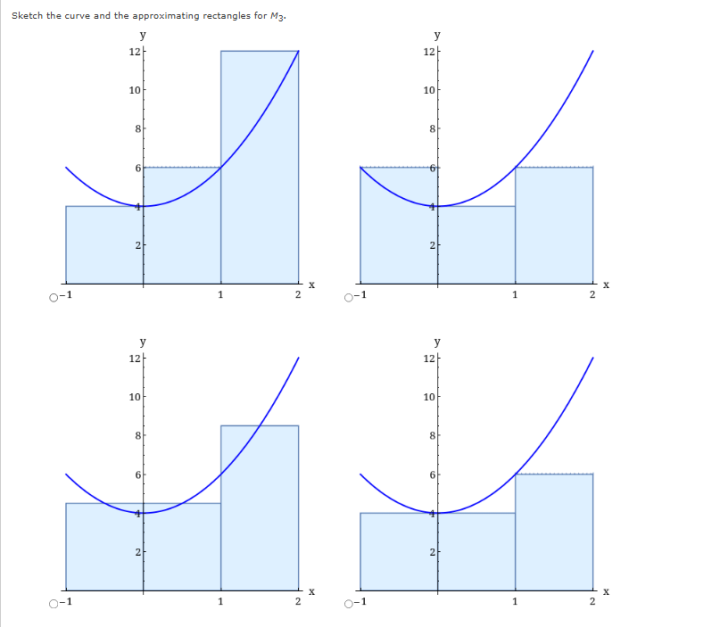
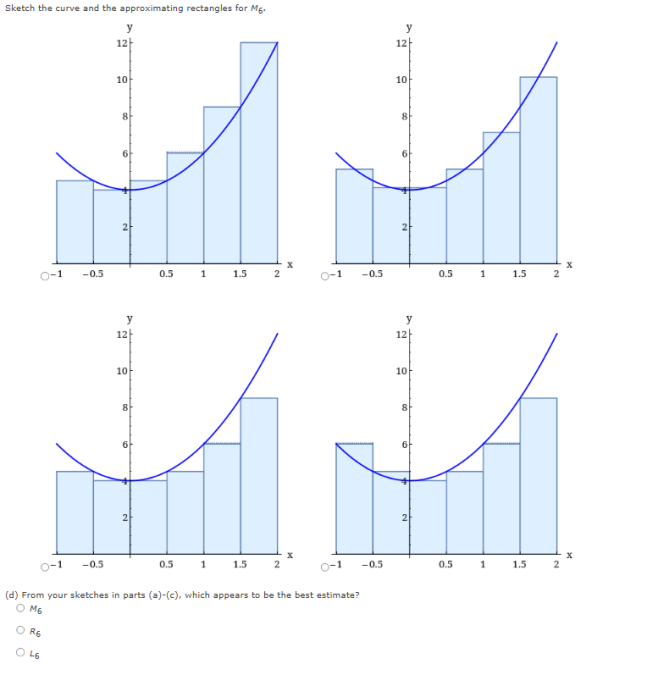
The table shows the marginal cost for a company's product at various production levels. Marginal cost Marginal cost Units ($/unit) Units ($/unit) 3.27 7000 2.17 1000 2.87 8000 2.16 2000 2.76 9000 2.18 3000 2.73 10,000 2.22 4000 2.53 11,000 2.33 5000 2.42 12,000 2.62 5000 2.27 13,090 2.82 (a) Estimate the cost (not including fixed costs) to produce the first 12,000 units by considering batches of 2000 units. Use the initial marginal cost for each batch in your calculations. $ (b) Use batches of 1000 units and the ending marginal cost for each batch to estimate the cost of raising the production level from 4000 to 11,000 units.(a) Estimate the area under the graph of A(x) = 4 + 2x" from x = -1 to x = 2 using three rectangles and right endpoints. R3 - Then improve your estimate by using six rectangles. R6 = Sketch the curve and the approximationg rectangles for R3. 12/ 12/ 10 10 8 0-1 2 0-1 2 12 12 10 10 8 6 0-1 2 0-1 2\fSketch the curve and the approximationg rectangles for L3. y 12 / 12 10 10 2 O-1 2 O-1 1 2 12/ 12/ 10 10 8 8 O-1 2 O-1 2Sketch the curve and the approximationg rectangles for L6- y 12 12 10 10 8 8 O-1 -0.5 0.5 1 1.5 2 O-1 -0.5 0.5 1 1.5 2 12 12 10 10 6 0-1 -0.5 0.5 1 1.5 0-1 -0.5 0.5 1 1.5 2 (c) Repeat part (a) using midpoints. M3=Sketch the curve and the approximationg rectangles for M3. 12 - 12/ 10 10 2 21 O-1 2 O-1 1 2 12 12/ 10 10/ O-1 2 O-1 2Sketch the curve and the approximationg rectangles for Me. y 12 12 10 10 0-1 -0.5 0.5 1.5 2 O-1 -0.5 0.5 K 1 1.5 2 12 12/ 10 10 0-1 -0.5 0.5 1.5 0-1 -0.5 0.5 1.5 2 (d) From your sketches in parts (=)-(c), which appears to be the best estimate? OMG O R6
Step by Step Solution
There are 3 Steps involved in it

Get step-by-step solutions from verified subject matter experts