

Question: I'm having trouble with making excel graphical results, micrographs, and grain size data. this is my data from my lab need help with the graphs
I'm having trouble with making excel graphical results, micrographs, and grain size data. this is my data from my lab
need help with the graphs and the table using excel
You are to determine the metallurgical differences between the failing and adequate bolts and report on the likely source of the problem and recommend appropriate action. You should include hardness data and graphical results, micrographs, grain size data and results (by at least two methods), and any other relevant observations in support of your findings
this is the PROCEDURE: Cut specimens suitable for mounting and hardness testing from the provided bolts using the abrasive cutoff saw. See safe operating procedures for operational instructions for the Buehler ABRASIMET Cut-off saw.Mount specimens in bakelite using the hydraulic mounting press. (Put both specimens in one mount). See safe operating procedures for operational instructions for the Buehler Mounting Press. 2. Polish samples. Refer to the polishing SOP for details about Polishing of Metallographic Specimens. 3. Etch the specimens using Nital solution. Quench the etched sample with methanol. 4. Examine the specimen surface using the digital microscope. Survey the specimen and choose a representative area. 5. Take a micrograph (for the technical memo) and make a sketch (in lab notebook) of representative areas of the specimens. You will evaluate grain size using 2 of the 5 aforementioned methods.
.
| xi hardness (HR) | |
| new bolt | 52.4 |
| 55.3 | |
| 56.4 | |
| 50.1 | |
| 52.2 | |
| old bolt | 66.7 |
| 66.9 | |
| 64.8 | |
| 65.7 | |
| 64.6 |
| x avg hardness (HR) new bolt | 53.28 |
| standard deviation new bolts | 2.543 |
| x avg hardness old bolts | 65.74 |
| standard deviation old bolts | 1.055 |
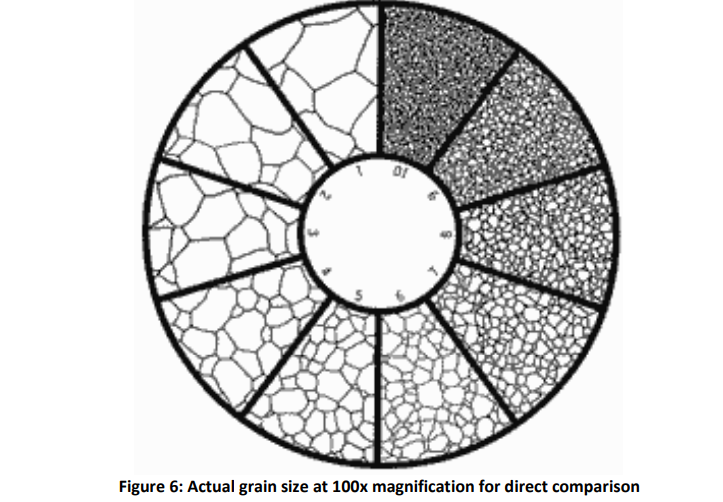
new Bolt (large grain) the grain size was a 4
this is 5 length new (mm)
0.25, 0.17, 0.26, 0.28, 0.21
old bolt (small grain) grain size was a 10
this is the 5 length old (mm)
0.03, 0.03, 0.04, 0.04, 0.03
Figure 6: Actual grain size at 100x magnitication tor direct comparison
Step by Step Solution
There are 3 Steps involved in it

Get step-by-step solutions from verified subject matter experts