

Question: I'm missing the question 4 2) Now draw the Demand and Supply curves using the following Demand and Supply Schedule: Demand Schedule: QIP Supply Schedule:
I'm missing the question 4
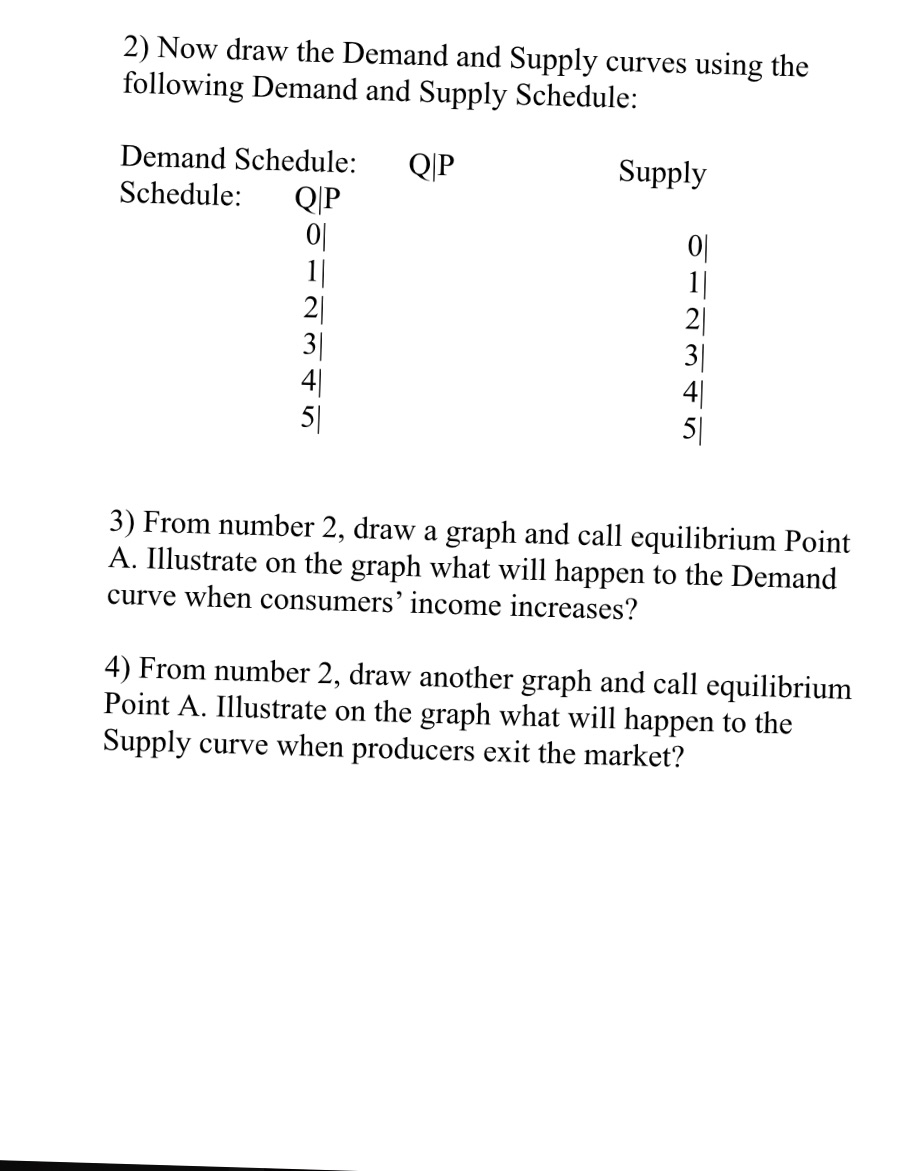
2) Now draw the Demand and Supply curves using the following Demand and Supply Schedule: Demand Schedule: QIP Supply Schedule: QIP 0| 0| ll 1 | 2| 2I 3| 3] 4| 4| 5] 5i 3) From number 2, draw a graph and call equilibrium Point A. Illustrate on the graph what will happen to the Demand curve when consumers' income increases? 4) From number 2, draw another graph and call equilibrium Point A. Illustrate on the graph what will happen to the Supply curve when producers exit the market
Step by Step Solution
There are 3 Steps involved in it
1 Expert Approved Answer
Step: 1 Unlock

Question Has Been Solved by an Expert!
Get step-by-step solutions from verified subject matter experts
Step: 2 Unlock
Step: 3 Unlock