

Question: I'm needing some help with this, please. Can you show me what I need to do? Note: Although not absolutely necessary, you are advised to
 I'm needing some help with this, please. Can you show me what I need to do?
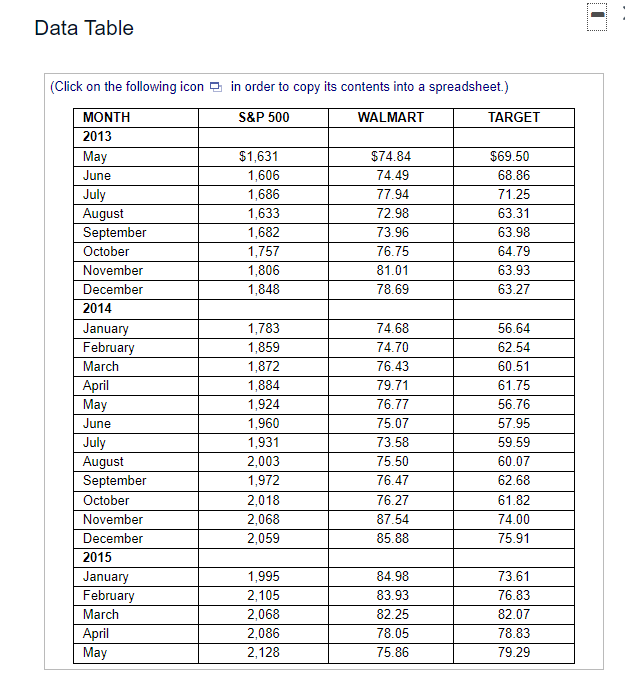
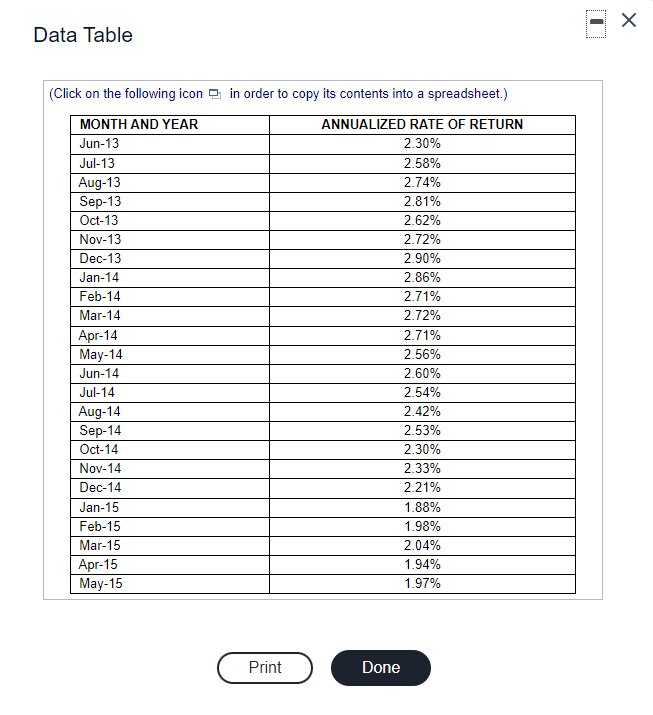
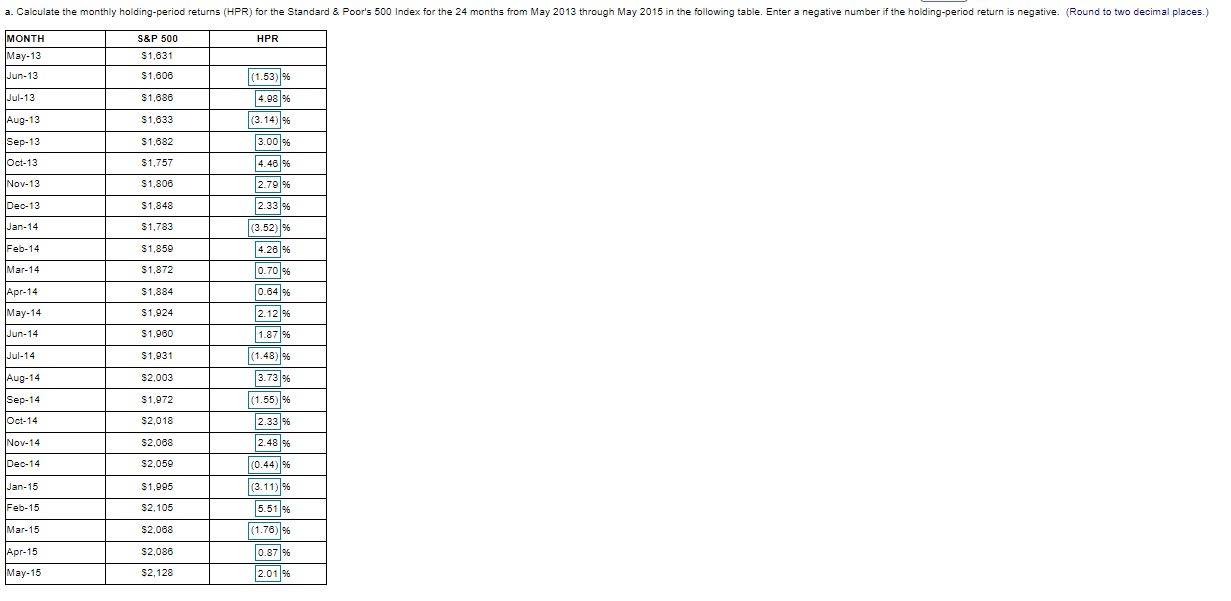
Note: Although not absolutely necessary, you are advised to use computer spreadsheet to work the following problem. a. Use the price data from the table in the popup window, B. for the Standard & Poor's 500 Index, Walmart, and Target to calculate the holding-period returns for the 24 months from May 2013 through May 2015. b. Calculate the average monthly holding-period returns and the standard deviation of these returns for the S&P 500 Index, Walmart, and Target. c. From the following graphs, describe the nature of the relationship between the stock returns for Walmart and the returns for the S&P 500 Index. d. Assume that you have decided to invest one-half of your money in Walmart and the remainder in Target. Calculate the monthly holding-period returns for your two-stock portfolio. (Hint: The monthly return for the portfolio is the average of the two stocks' monthly returns.) e. The table in the popup window, shows the returns on an annualized basis that were realized from holding long-term government bonds for the same period. Calculate the average monthly holding-period returns and the standard deviations of these returns. (Hint: You will need to convert the annual returns to monthly returns by dividing each return by 12 months.) f. Now assuming that you have decided to invest equal amounts of money in Walmart, Target, and long-term government securities, calculate the monthly returns for your three-asset portfolio. What are the average return and the standard deviation? g. Make a comparison of the average returns and the standard deviations for all the individual assets and the two portfolios that we designed. What conclusions can be reached by your comparison? h. According to Standard & Poor's, the betas for Walmart and Target are 0.28 and 0.75, respectively. Compare the meaning of these betas relative to the standard deviations calculated above. i. Assume that the current Treasury bill rate is 3 percent and that the expected market return is 10 percent. Given the betas for Walmart and Target in part h, estimate an appropriate rate of return for the two firms. Data Table (Click on the following icon in order to copy its contents into a spreadsheet.) MONTH S&P 500 WALMART TARGET 2013 May $1,631 $74.84 $69.50 June 1,606 74.49 68.86 July 1,686 77.94 71.25 August 1,633 72.98 63.31 September 1,682 73.96 63.98 October 1,757 76.75 64.79 November 1,806 81.01 63.93 December 1,848 78.69 63.27 2014 January 1,783 74.68 56.64 February 1,859 74.70 62.54 March 1,872 76.43 60.51 April 1,884 79.71 61.75 1,924 76.77 56.76 June 1,960 75.07 57.95 July 1,931 73.58 59.59 August 2,003 75.50 60.07 September 1,972 76.47 62.68 October 2,018 76.27 61.82 November 2,068 87.54 74.00 December 2,059 85.88 75.91 2015 January 1,995 84.98 73.61 February 2,105 83.93 76.83 March 2,068 82.25 82.07 April 2,086 78.05 78.83 2,128 75.86 79.29 May May Data Table (Click on the following icon in order to copy its contents into a spreadsheet.) MONTH AND YEAR ANNUALIZED RATE OF RETURN Jun-13 2.30% Jul-13 2.58% Aug-13 2.74% Sep-13 2.81% Oct-13 2.62% Nov-13 2.72% Dec-13 2.90% Jan-14 2.86% Feb-14 2.71% Mar-14 2.72% Apr-14 2.71% May-14 2.56% Jun-14 2.60% Jul-14 2.54% Aug-14 2.42% Sep-14 2.53% Oct-14 2.30% Nov-14 2.33% Dec-14 2.21% Jan-15 1.88% Feb-15 1.98% Mar-15 2.04% Apr-15 1.94% May-15 1.97% Print Done a. Calculate the monthly holding-period returns (HPR) for the Standard & Poor's 500 Index for the 24 months from May 2013 through May 2015 in the following table. Enter a negative number if the holding-period return is negative. (Round to two decimal places.) MONTH S&P 500 HPR May-13 $1,631 Jun-13 $1,606 (1.53) % Jul-13 $1,686 4.98% Aug-13 $1,633 (3.14) 96 ( Sep-13 $1,682 3.00% Oct-13 $1,757 4.46% Nov-13 $1,806 2.79% Dec-13 $1,848 2.3396 Jan-14 $1,783 Feb-14 $1,859 (3.52) % 4.26% 0.70% Mar-14 $1,872 Apr-14 $1,884 0.8496 May-14 $1.924 Jun-14 $1.960 Jul-14 $1,931 Aug-14 $2,003 2.12 % 1.87% ( (1.48) % 3.7396 (1.55) 2.33% 2.48% Sep-14 $1.972 JOct-14 $2.018 Nov-14 $2,068 Dec-14 $2,050 (0.44)% Jan-15 $1,995 Feb-15 S2,105 Mar-15 $2,068 (3.11) % 5.51% (1.76) % 0.87% 2.01% Apr-15 $2.088 May-15 S2, 128
Step by Step Solution
There are 3 Steps involved in it

Get step-by-step solutions from verified subject matter experts