

Question: im needing yo know the excel formulas for question #4 purple chart insert into excel that would get me the answer numbers to the chart.
im needing yo know the excel formulas for question #4 purple chart insert into excel that would get me the answer numbers to the chart. 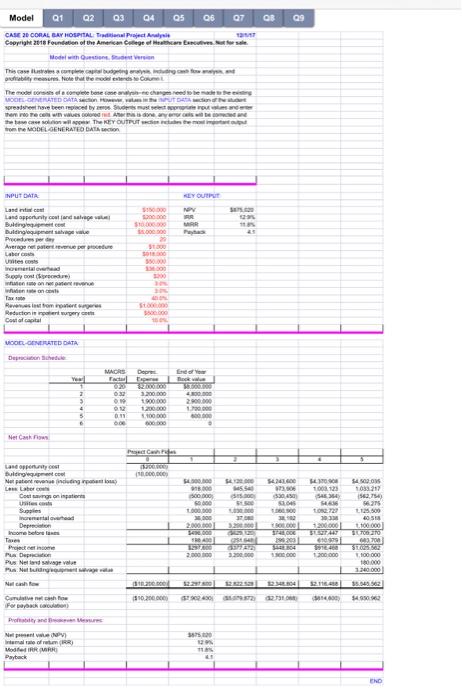
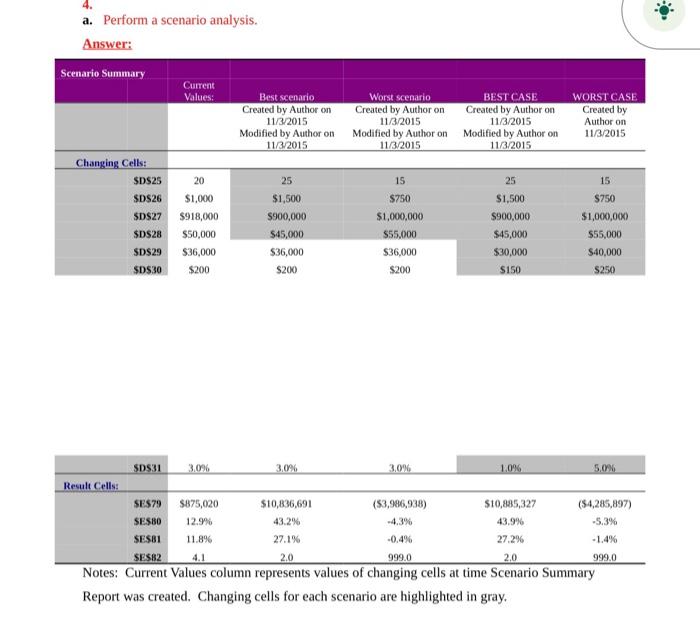
a. Perform a scenario analysis. Answer: Notes: Current Values column represents values of changing cells at time Scenario Summary Report was created. Changing cells for each scenario are highlighted in gray
Step by Step Solution
There are 3 Steps involved in it
1 Expert Approved Answer
Step: 1 Unlock

Question Has Been Solved by an Expert!
Get step-by-step solutions from verified subject matter experts
Step: 2 Unlock
Step: 3 Unlock