

Question: I'm not sure how to do this! Can someone please help me! Due Jun 21 at 11:59pm Points 100 Questions 1 Time Limit None Instructions
I'm not sure how to do this! Can someone please help me!
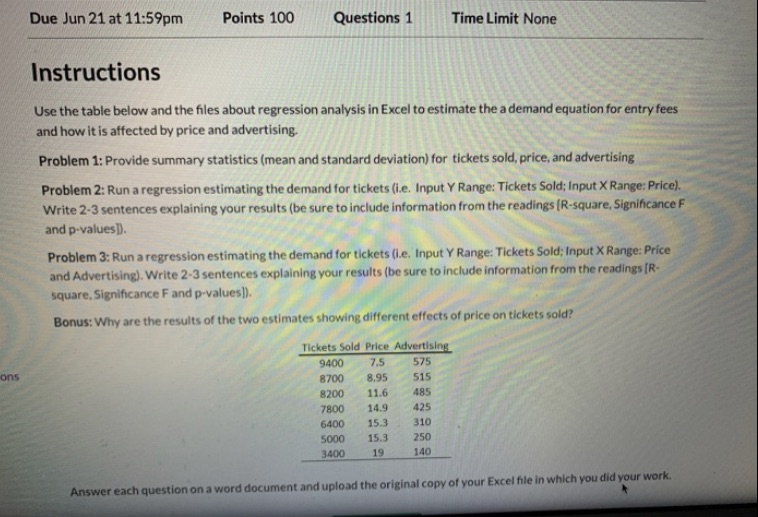
Due Jun 21 at 11:59pm Points 100 Questions 1 Time Limit None Instructions Use the table below and the files about regression analysis in Excel to estimate the a demand equation for entry fees and how it is affected by price and advertising. Problem 1: Provide summary statistics (mean and standard deviation) for tickets sold, price, and advertising Problem 2: Run a regression estimating the demand for tickets (i.e. Input Y Range: Tickets Sold; Input X Range: Price). Write 2-3 sentences explaining your results (be sure to include information from the readings [R-square, Significance F and p-values D). Problem 3: Run a regression estimating the demand for tickets (i.e. Input Y Range: Tickets Sold; Input X Range: Price and Advertising). Write 2-3 sentences explaining your results (be sure to include information from the readings [R- square. Significance F and p-values 1). Bonus: Why are the results of the two estimates showing different effects of price on tickets sold? Tickets Sold Price Advertising 9400 7.5 575 ons 8700 8.95 515 8200 11.6 485 7800 14.9 425 6400 15.3 310 5000 15.3 250 3400 19 140 Answer each question on a word document and upload the original copy of your Excel file in which you did your work
Step by Step Solution
There are 3 Steps involved in it

Get step-by-step solutions from verified subject matter experts