

Question: I'm not sure how to work through this problem because I do not know what numbers to plug in for the variables. This is all
I'm not sure how to work through this problem because I do not know what numbers to plug in for the variables. This is all of the information that I was given, so hopefully you can help me out. Below I have provided both the problem and the formulas for Run Tests.
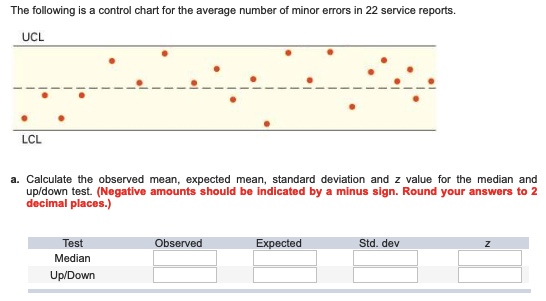
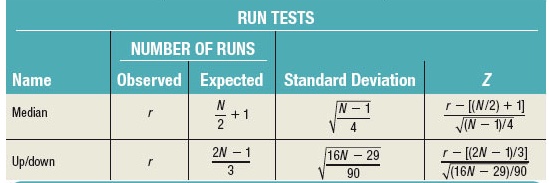
The following is a control chart for the average number of minor errors in 22 service reports. UCL LCL a. Calculate the observed mean, expected mean, standard deviation and z value for the median and up/down test. (Negative amounts should be indicated by a minus sign. Round your answers to 2 decimal places.) Test Observed Expected Std. dev Z Median Up/DownRUN TESTS NUMBER OF RUNS Name Observed Expected Standard Deviation Z Median NZ + 1 N- 1 r - [(N/2) + 1] VIN - 1)/4 Up/down 2N - 1 F 16/ - 29 F - [(2N - 1)/3] 3 90 (16/ - 29)/90
Step by Step Solution
There are 3 Steps involved in it

Get step-by-step solutions from verified subject matter experts