

Question: I'm not sure if my first answer is even correct but I need assistance overall. Note: Histograms show data distribution to see if data is
I'm not sure if my first answer is even correct but I need assistance overall.
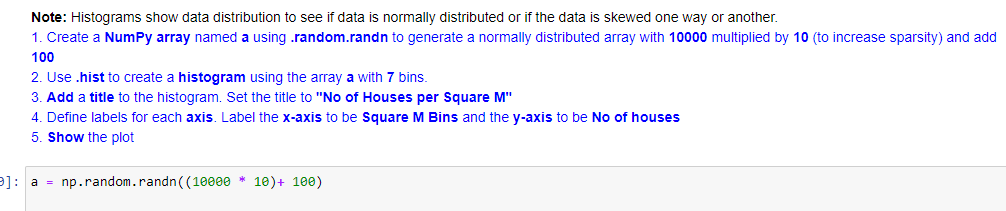
Note: Histograms show data distribution to see if data is normally distributed or if the data is skewed one way or another. 1. Create a NumPy array named a using .random.randn to generate a normally distributed array with 10000 multiplied by 10 (to increase sparsity) and add 100 2. Use .hist to create a histogram using the array a with 7 bins. 3. Add a title to the histogram. Set the title to "No of Houses per Square M" 4. Define labels for each axis. Label the x-axis to be Square M Bins and the y-axis to be No of houses 5. Show the plot 37: a = np . random . randn((10000 * 10)+ 100)
Step by Step Solution
There are 3 Steps involved in it

Get step-by-step solutions from verified subject matter experts