

Question: I'm not sure what numbers will go on the data plot diagram Data Table Directions: X = Y= Case I-RISC Problem Type the highlighted case
I'm not sure what numbers will go on the data plot diagram
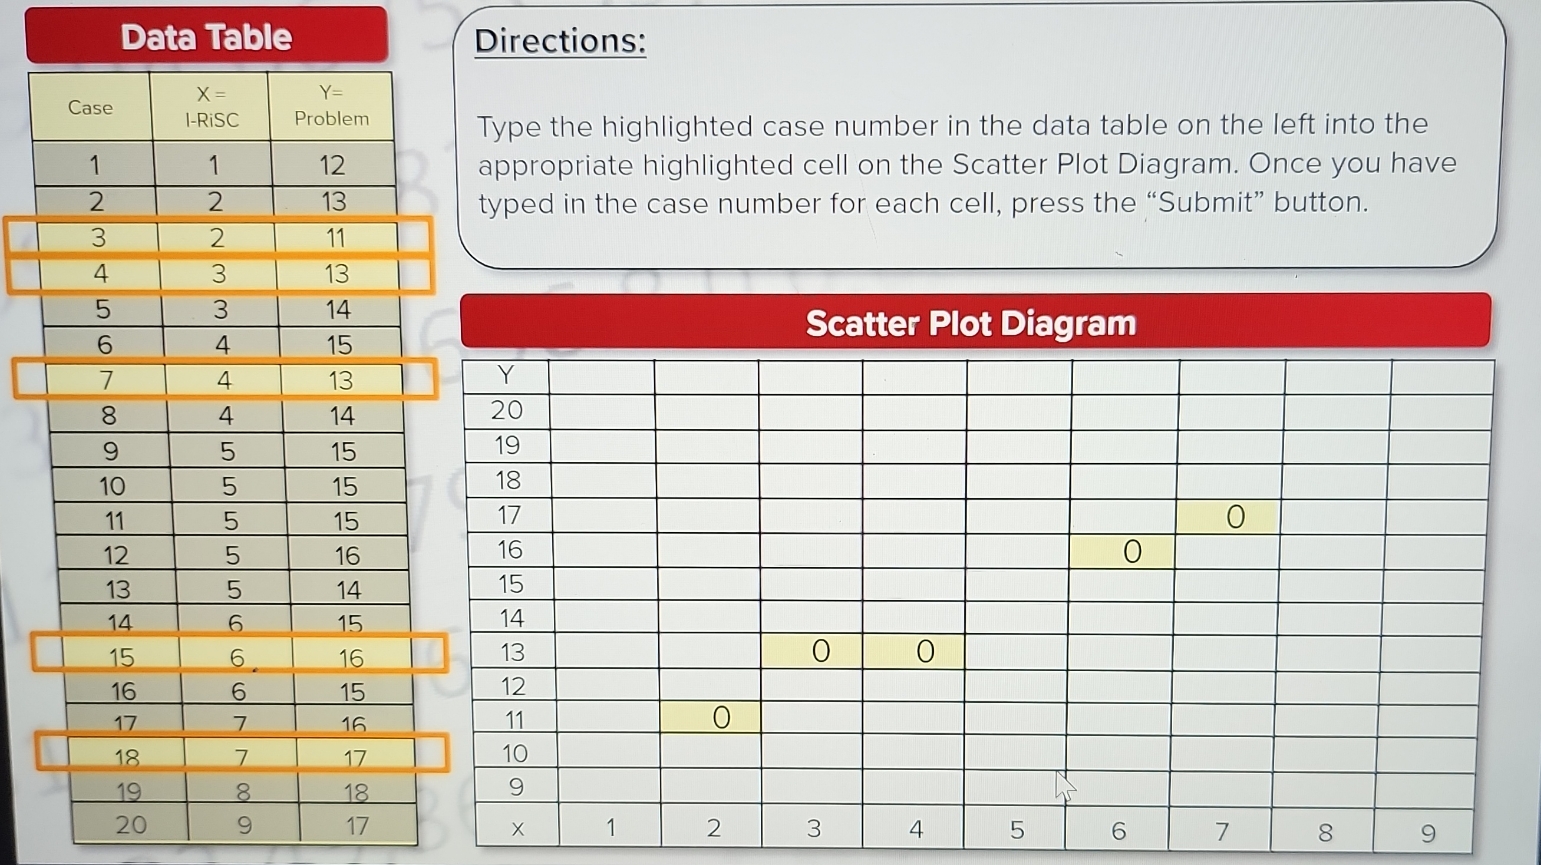
Data Table Directions: X = Y= Case I-RISC Problem Type the highlighted case number in the data table on the left into the - 1 12 appropriate highlighted cell on the Scatter Plot Diagram. Once you have 2 2 13 typed in the case number for each cell, press the "Submit" button. 3 2 11 4 3 13 3 14 6 4 15 Scatter Plot Diagram 7 4 13 Y 8 14 20 9 15 19 10 UT 15 18 11 5 15 17 0 12 5 16 16 0 13 5 14 15 14 6 15 14 15 6 16 13 0 O 16 6 15 12 17 7 16 11 O 18 7 17 10 19 8 18 9 20 9 17 X 1 2 3 4 5 6 7 8 9
Step by Step Solution
There are 3 Steps involved in it
1 Expert Approved Answer
Step: 1 Unlock

Question Has Been Solved by an Expert!
Get step-by-step solutions from verified subject matter experts
Step: 2 Unlock
Step: 3 Unlock