

Question: I'm not sure which is the correct graph. Is it A, B or C. Pictures are in order K Suppose that $66,000 is invested at


I'm not sure which is the correct graph. Is it A, B or C. Pictures are in order
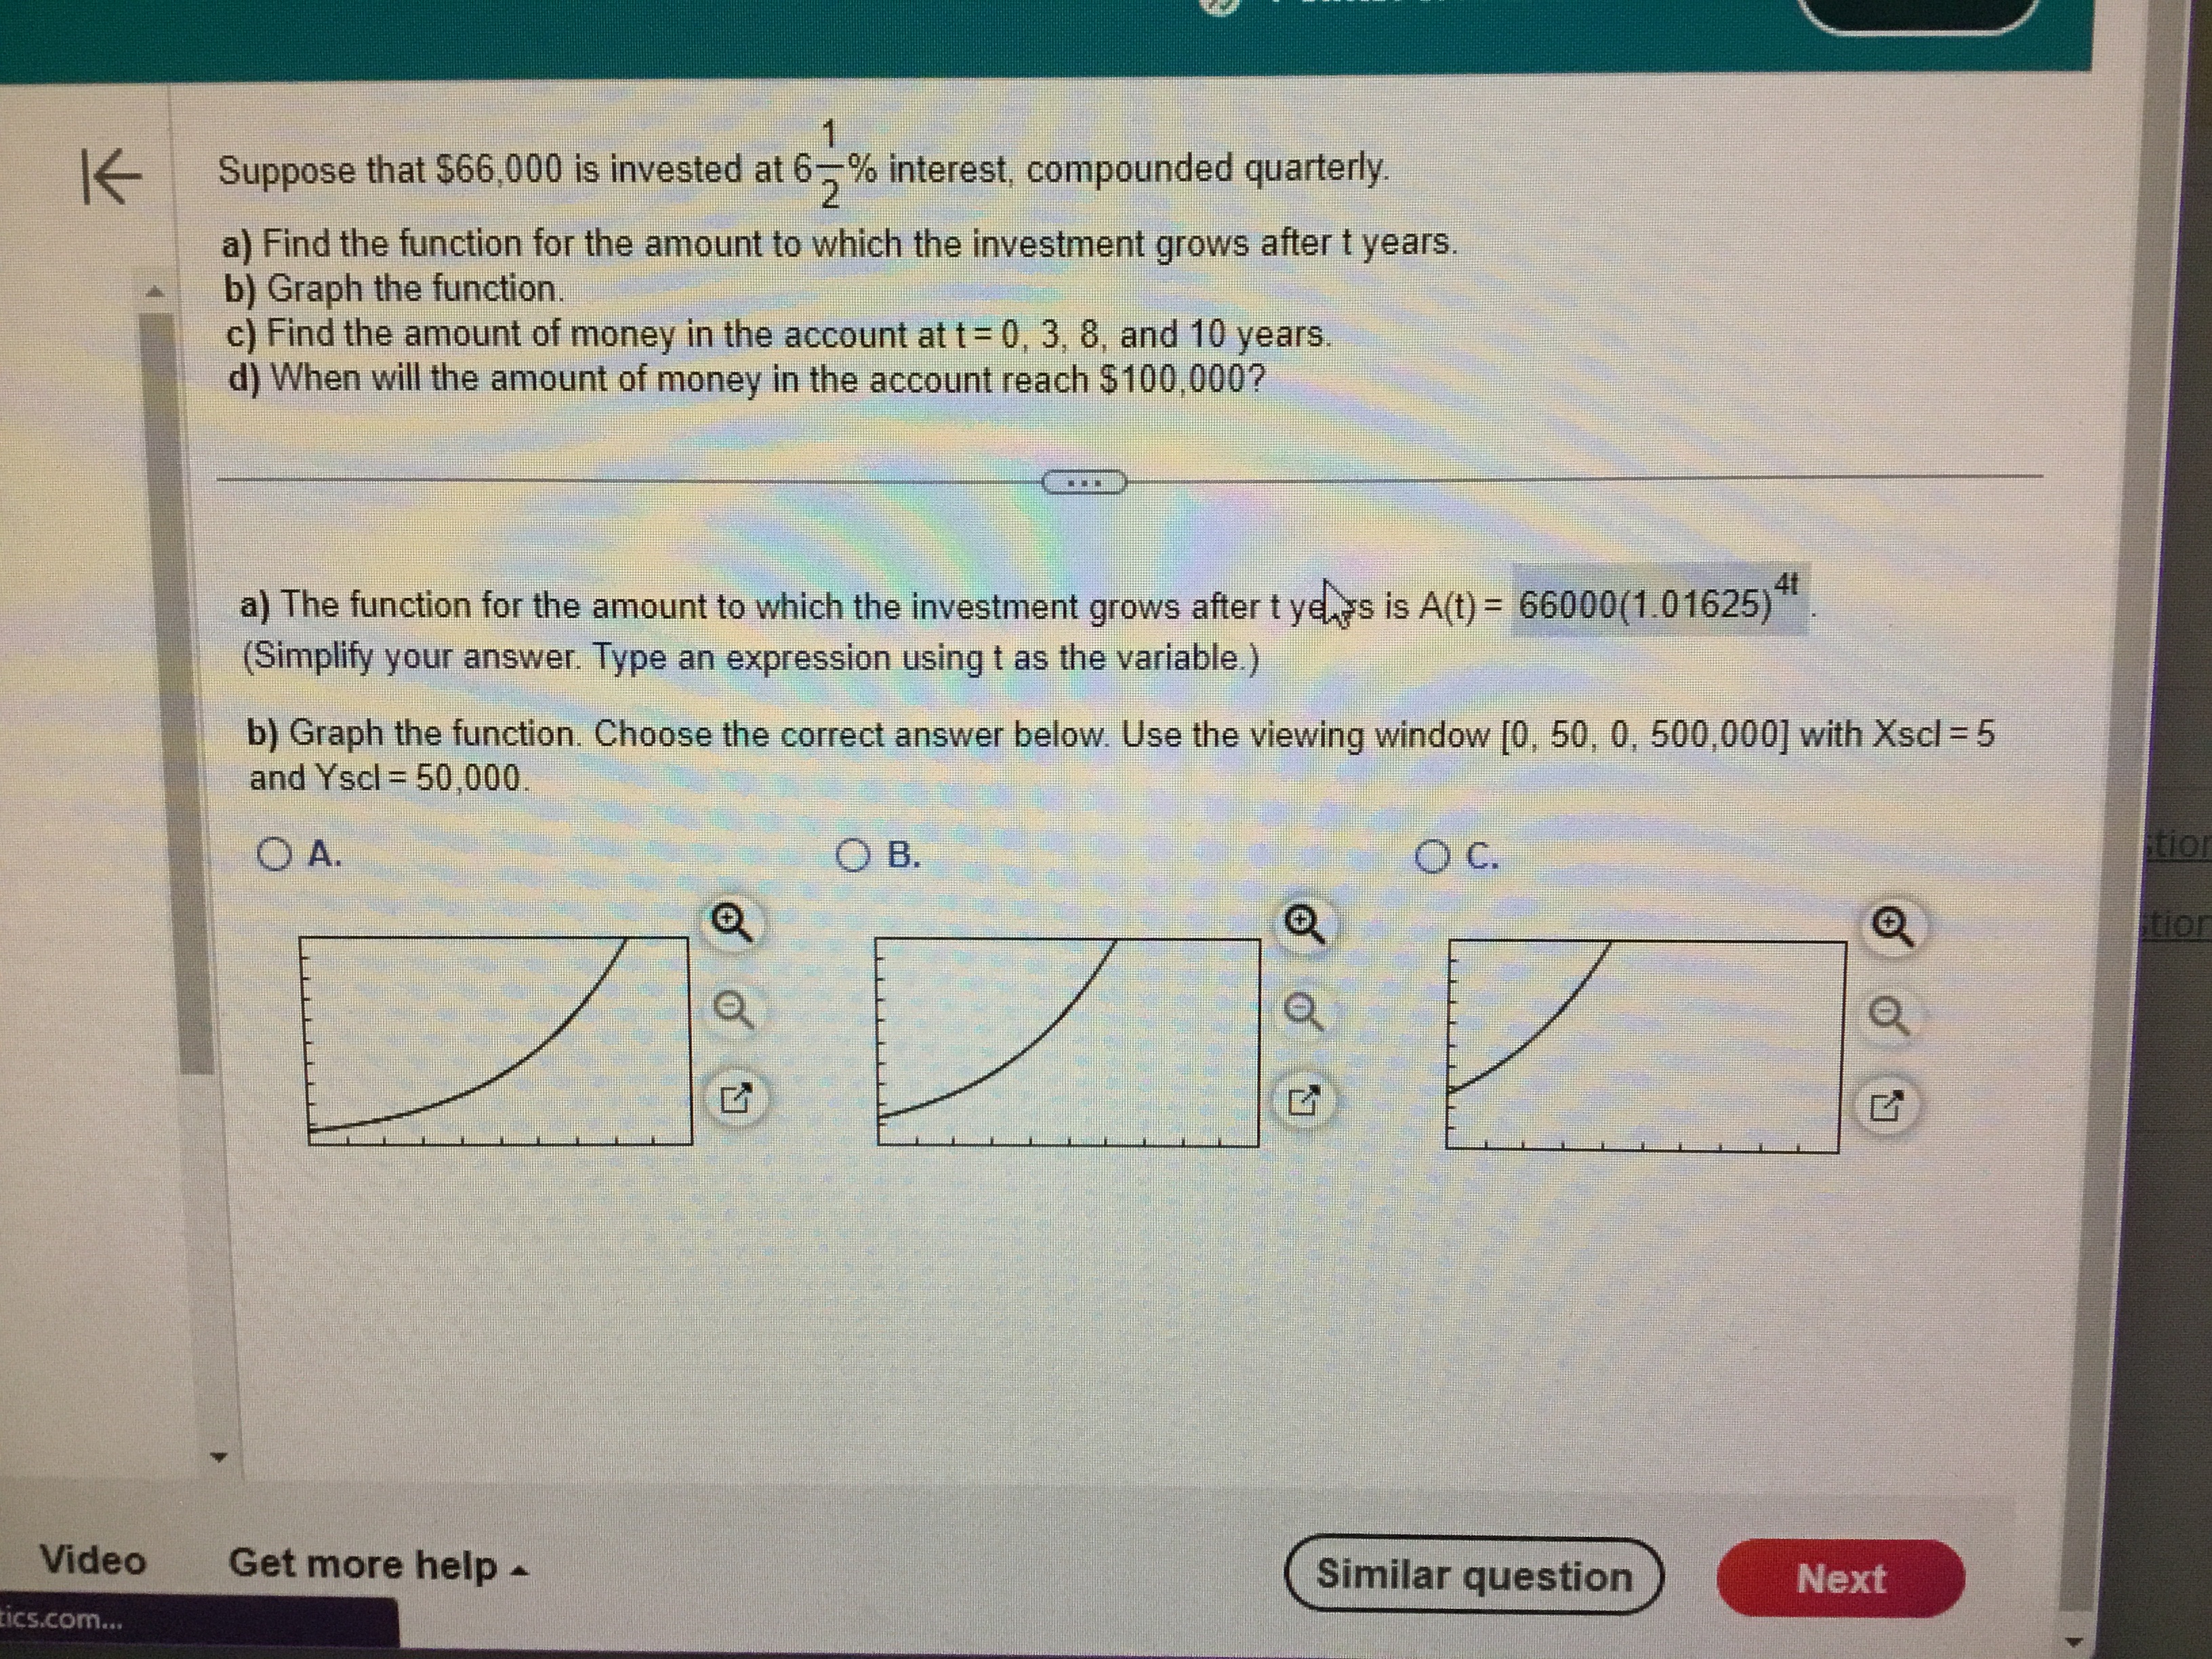


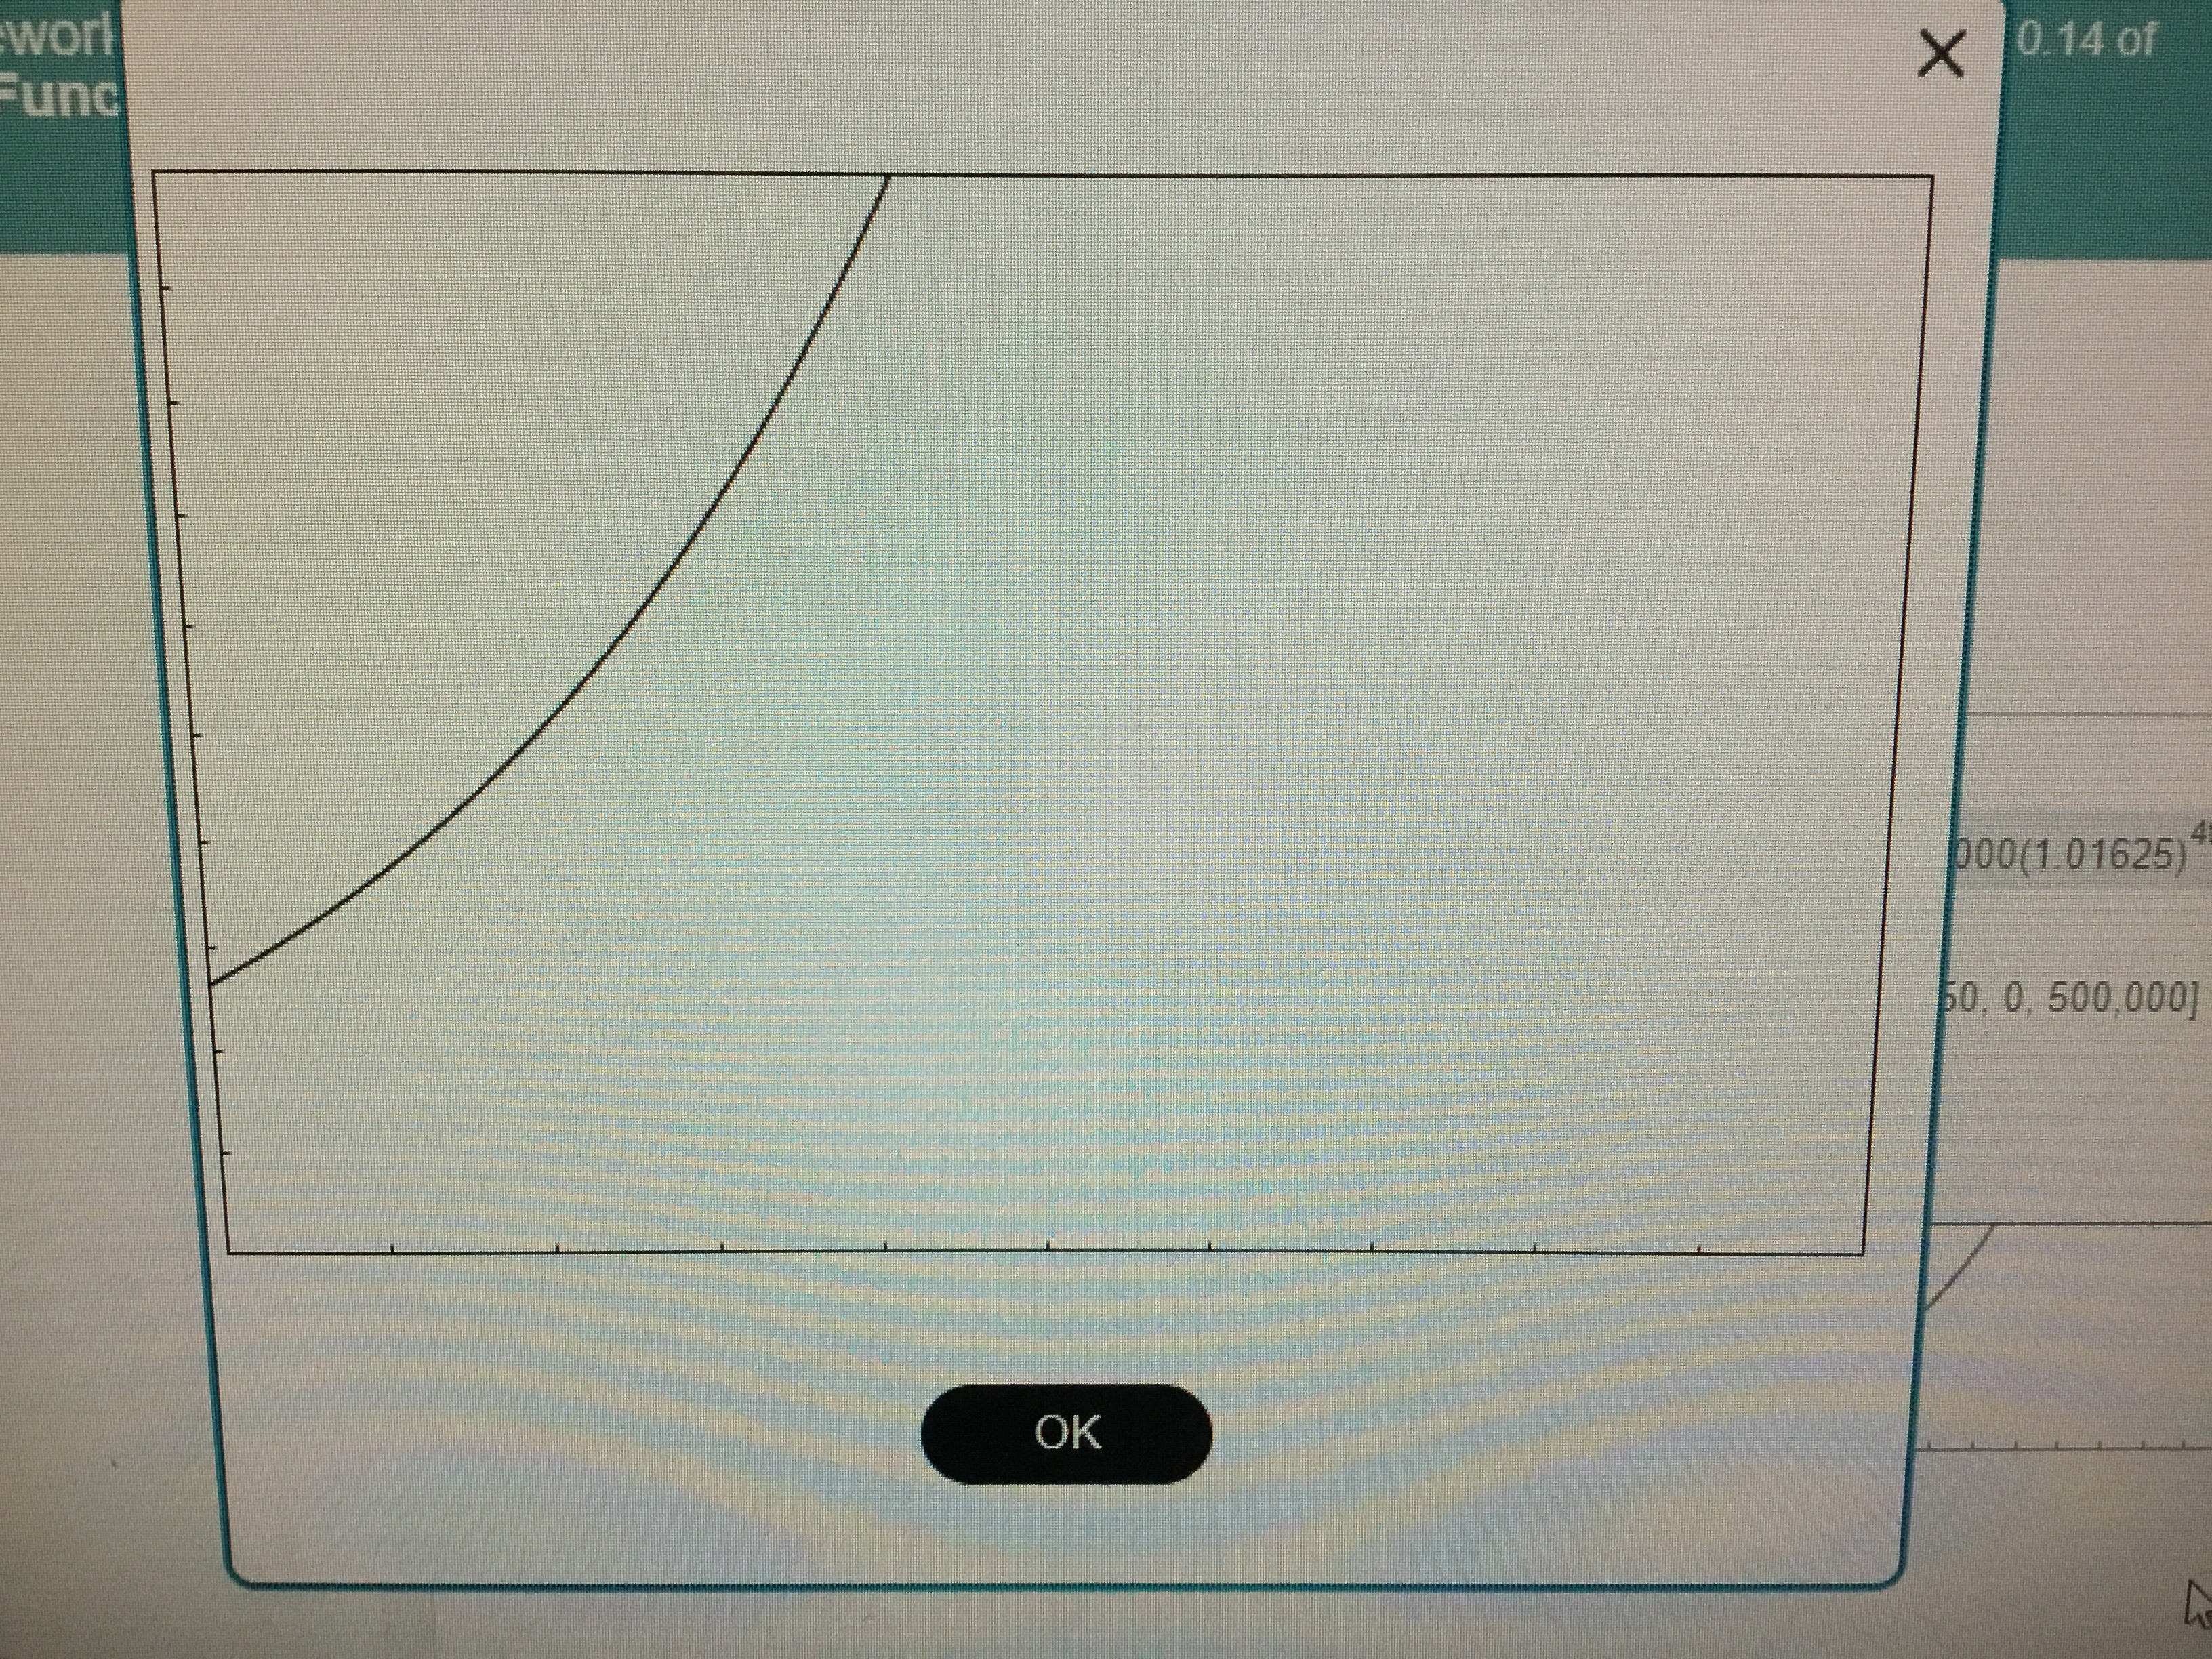
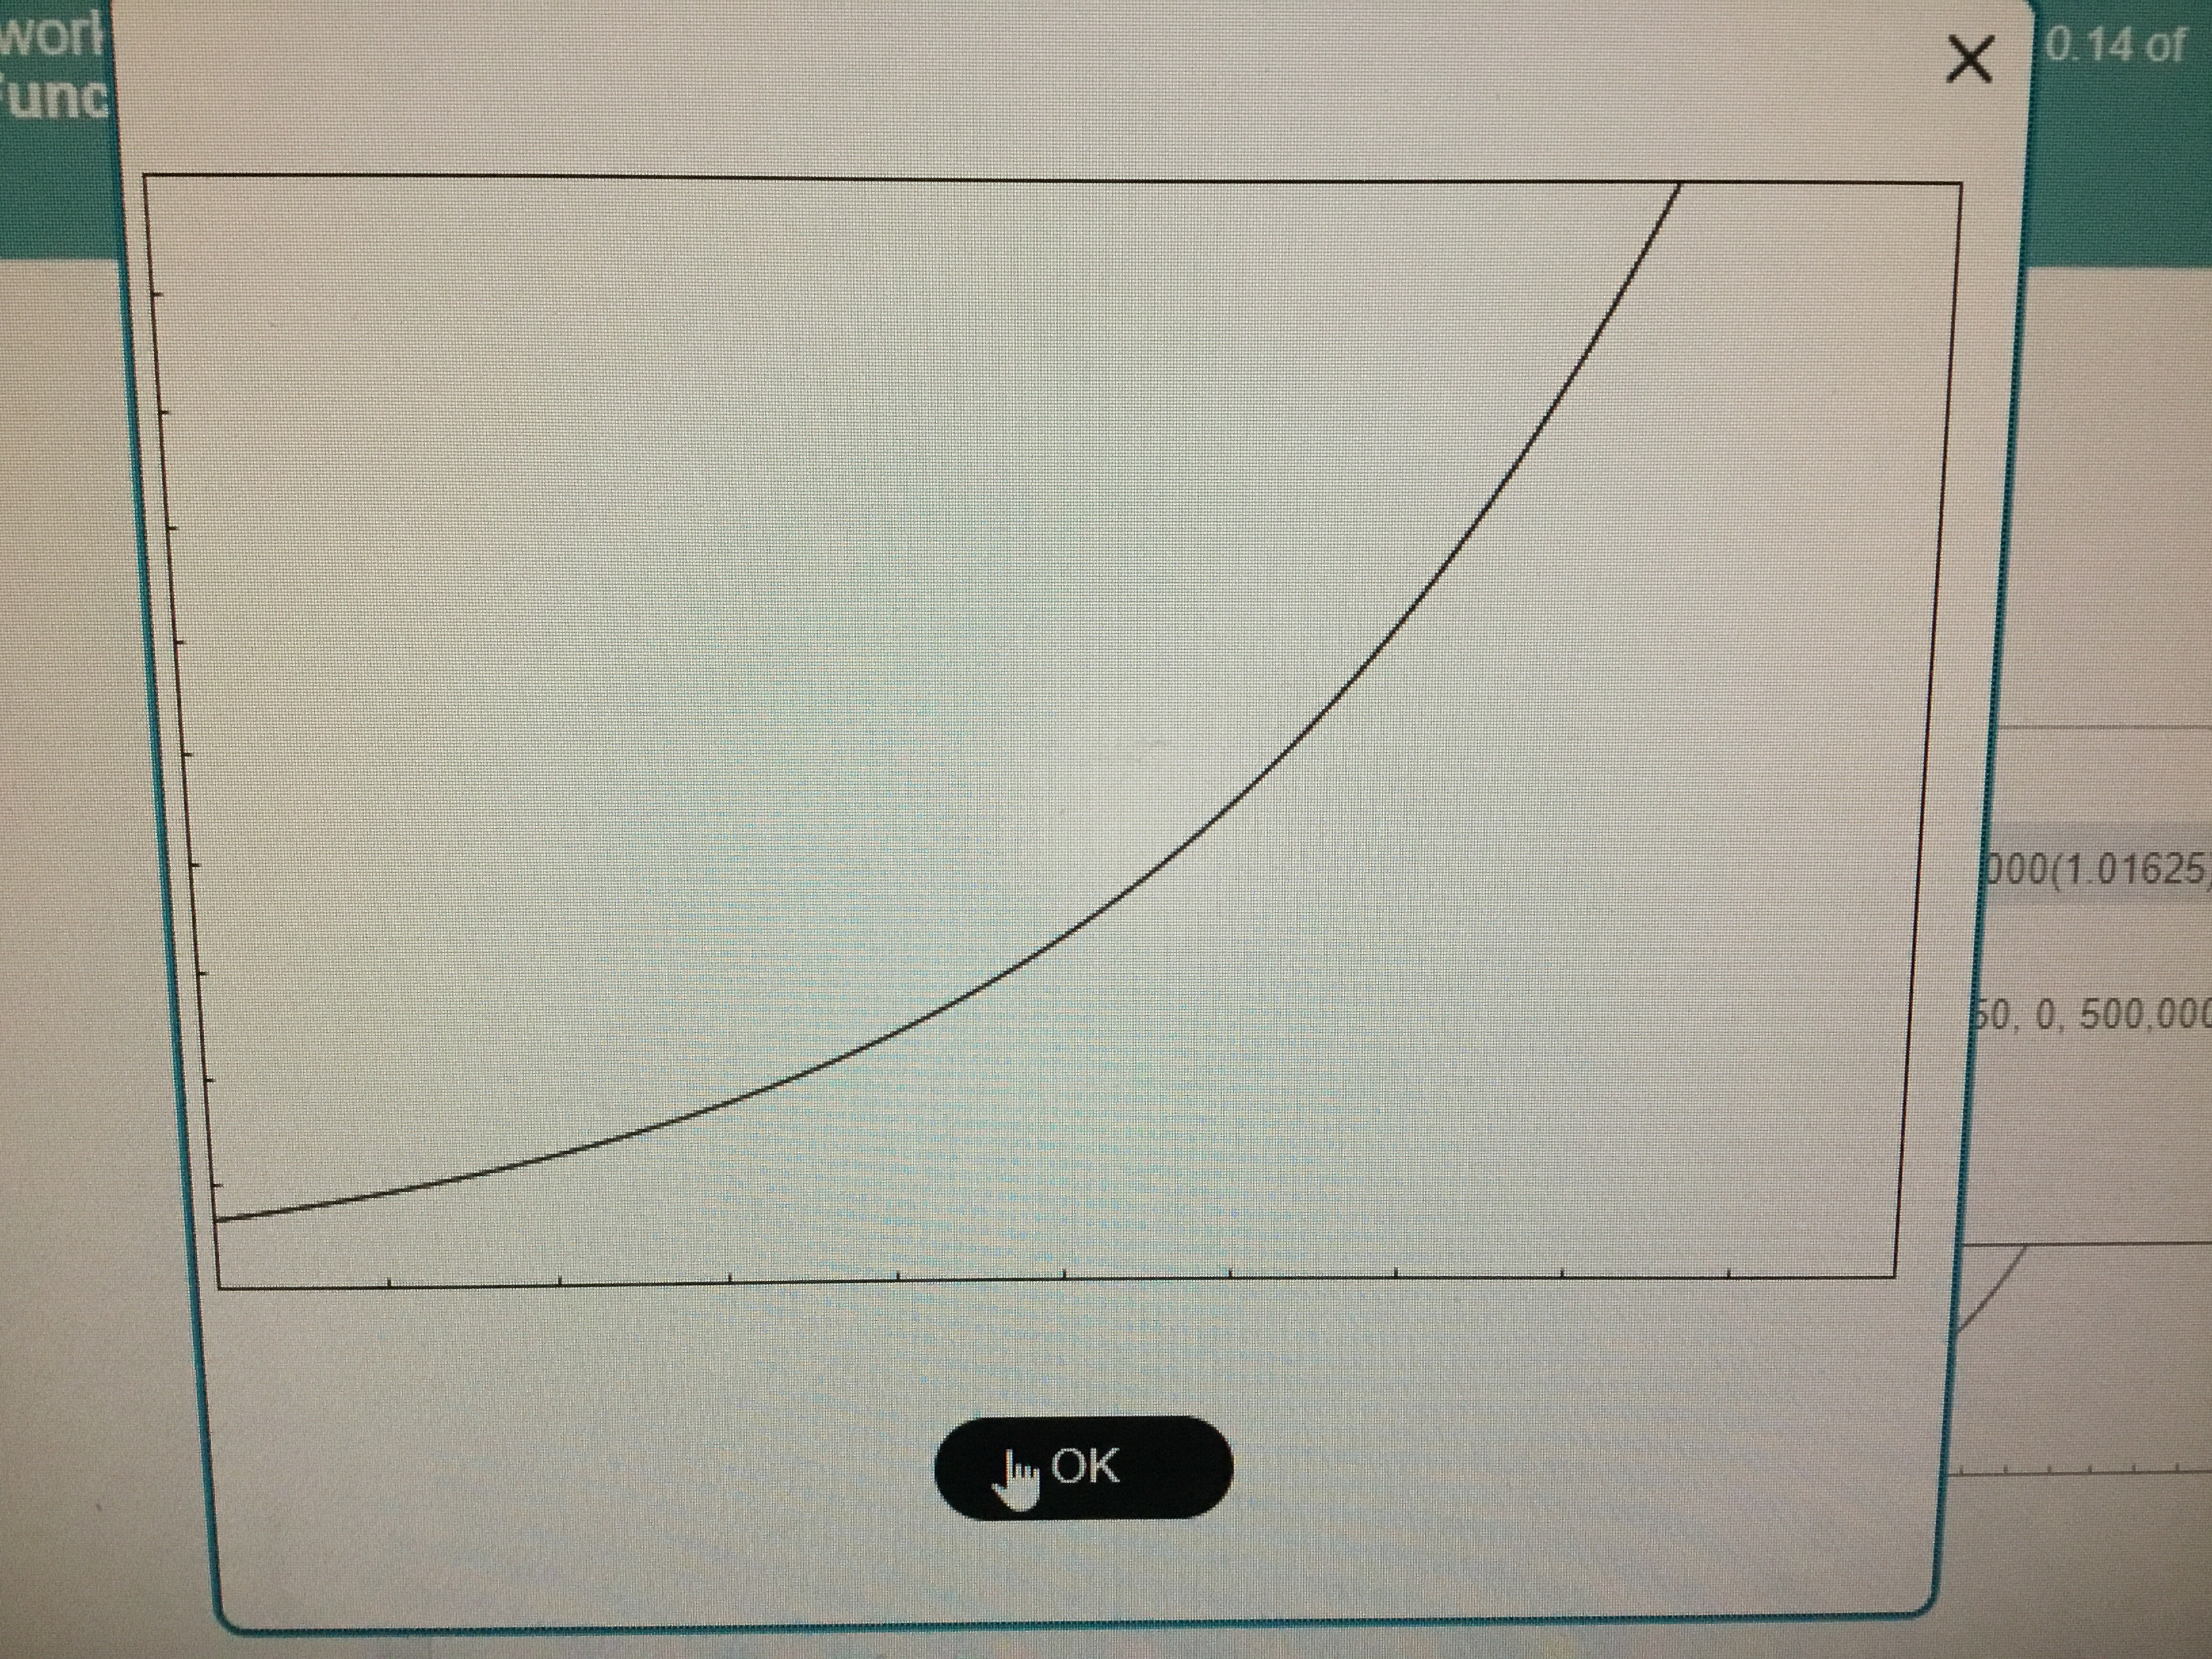
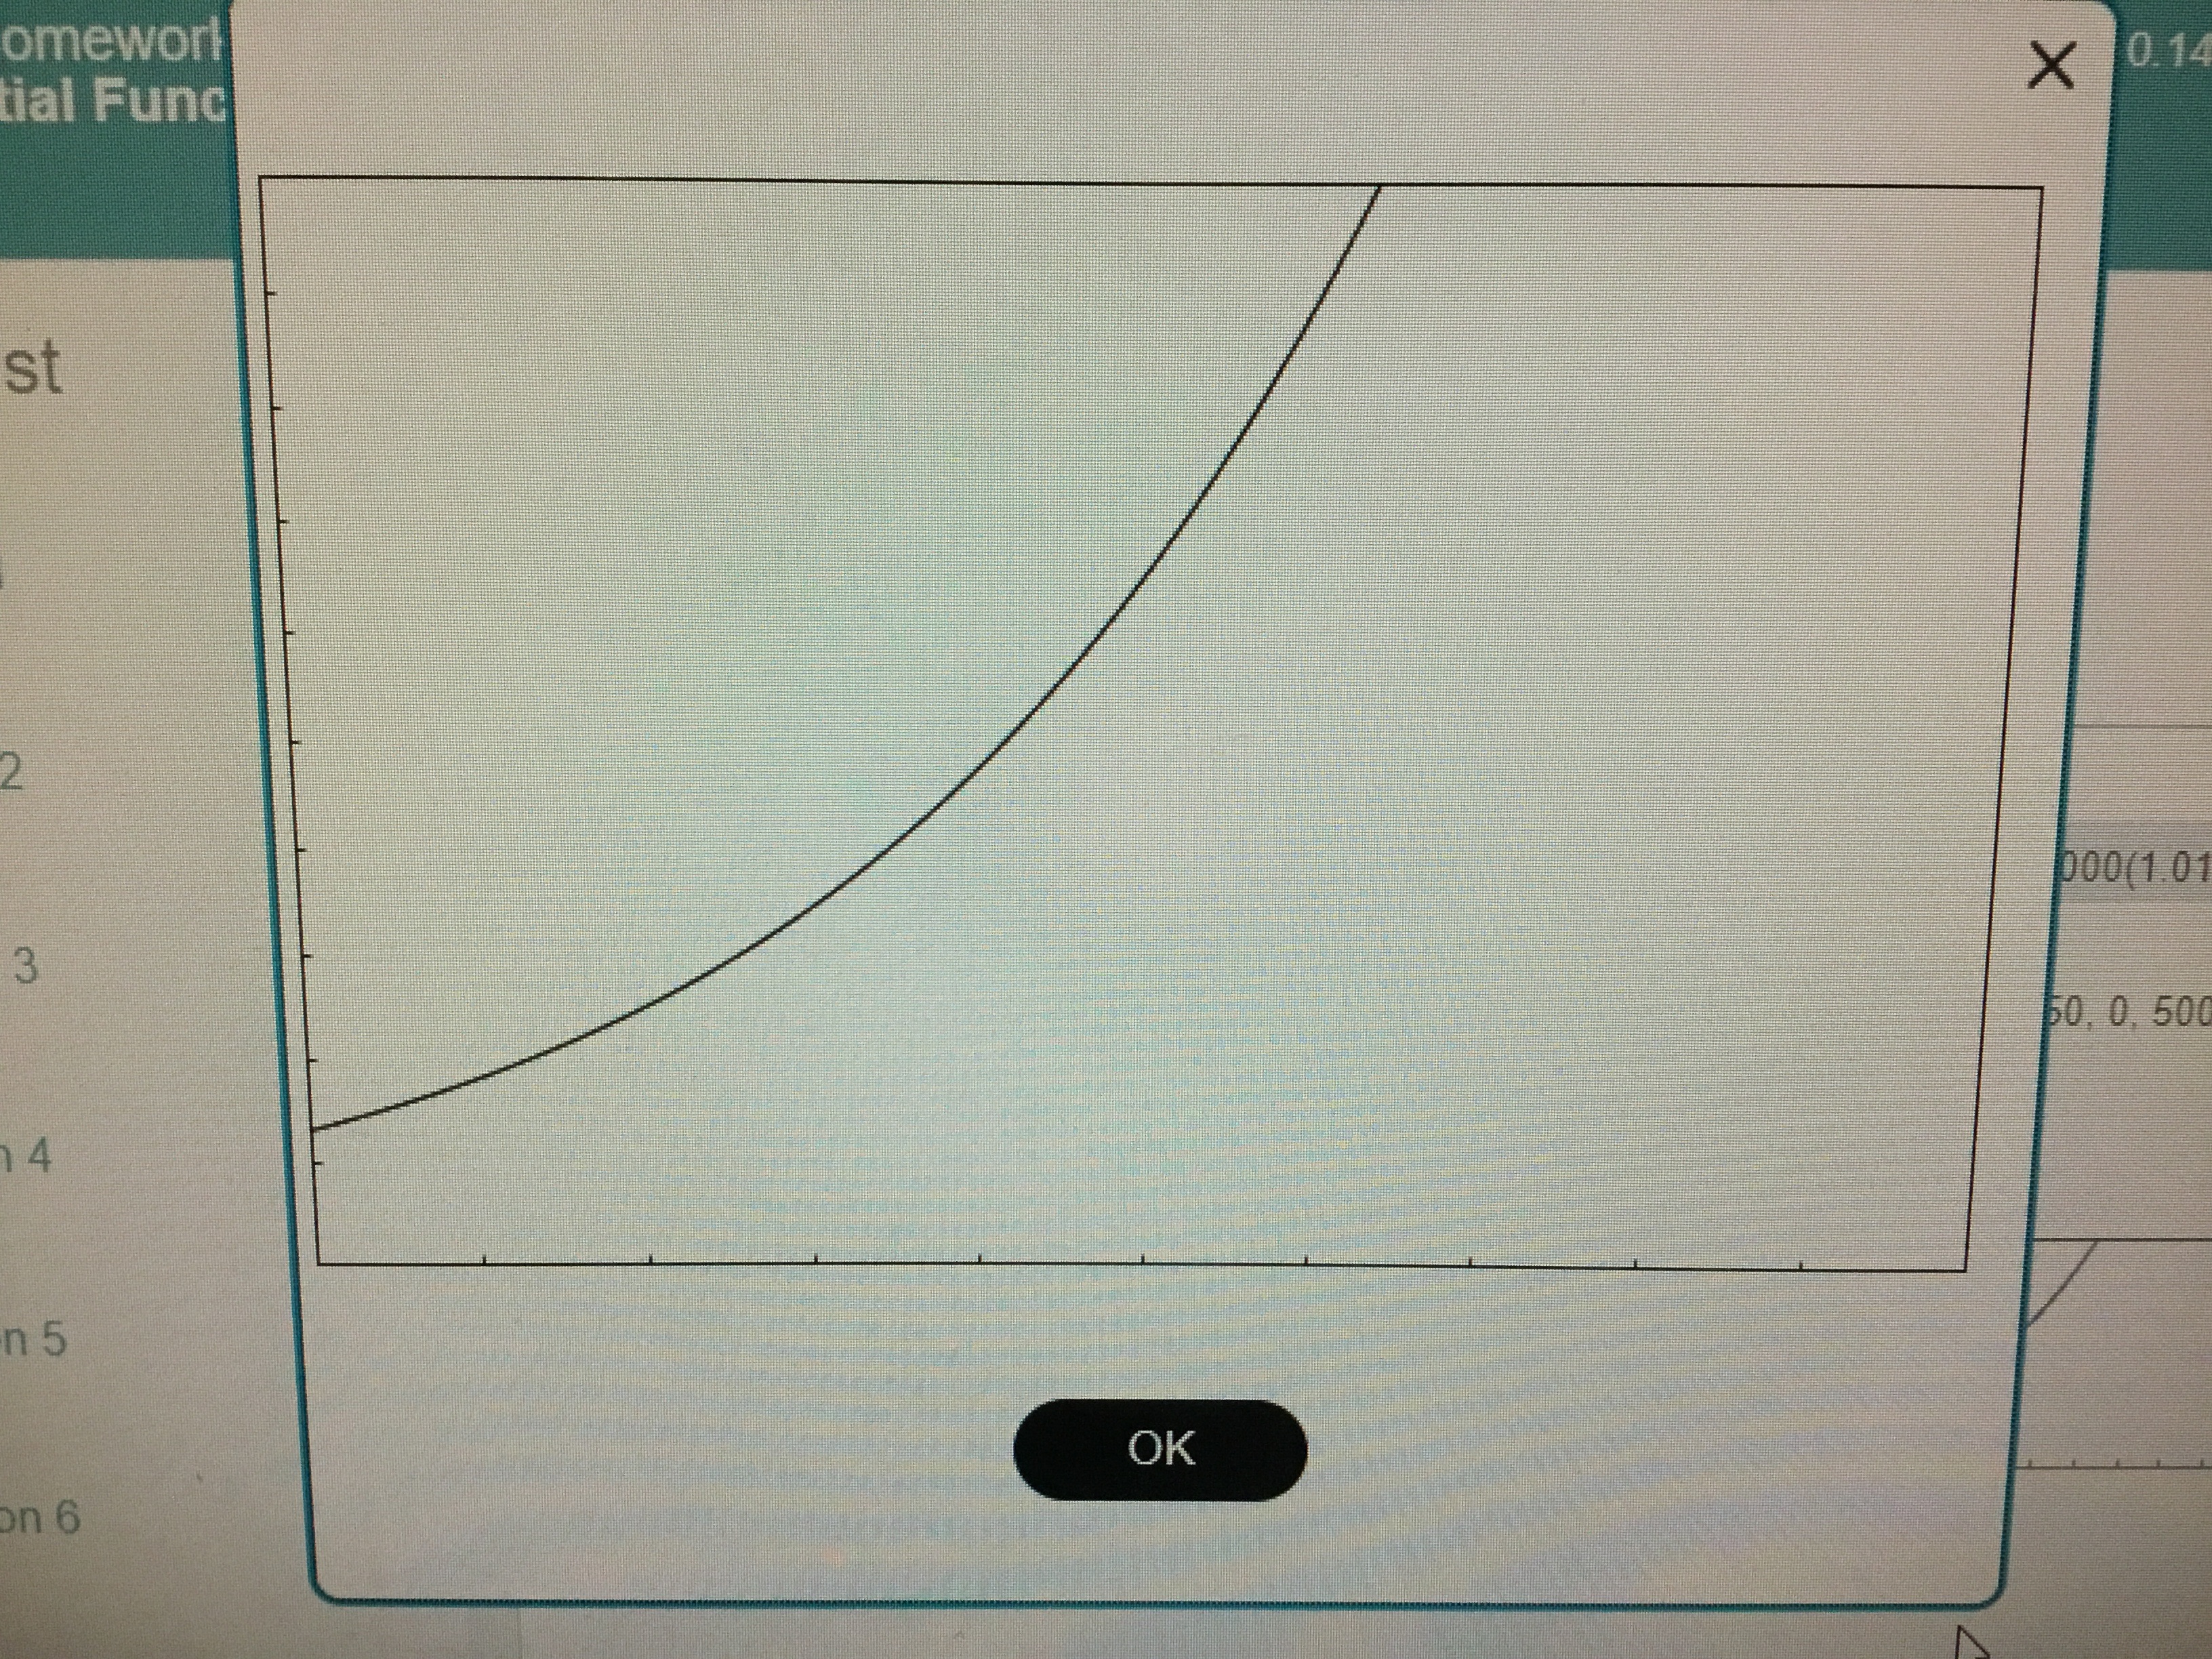
K Suppose that $66,000 is invested at 65% interest, compounded quarterly. a) Find the function for the amount to which the investment grows after t years b) Graph the function. c) Find the amount of money in the account at t = 0, 3, 8, and 10 years. d) When will the amount of money in the account reach $100,000? a) The function for the amount to which the investment grows after t yelps is A(t) = 66000(1.01625)# (Simplify your answer. Type an expression using t as the variable.) b) Graph the function. Choose the correct answer below. Use the viewing window [0, 50, 0, 500,000] with Xsol = 5 and Yscl = 50,000. OA. O B. O C. tio tio Video Get more help - Similar question Next ics.com...worl unc X 0.14 of Do0(1 01625 50, 0, 500,00 In OK
Step by Step Solution
There are 3 Steps involved in it

Get step-by-step solutions from verified subject matter experts