I'm not sure which Template i'm supposed to use can you also explain which one and why?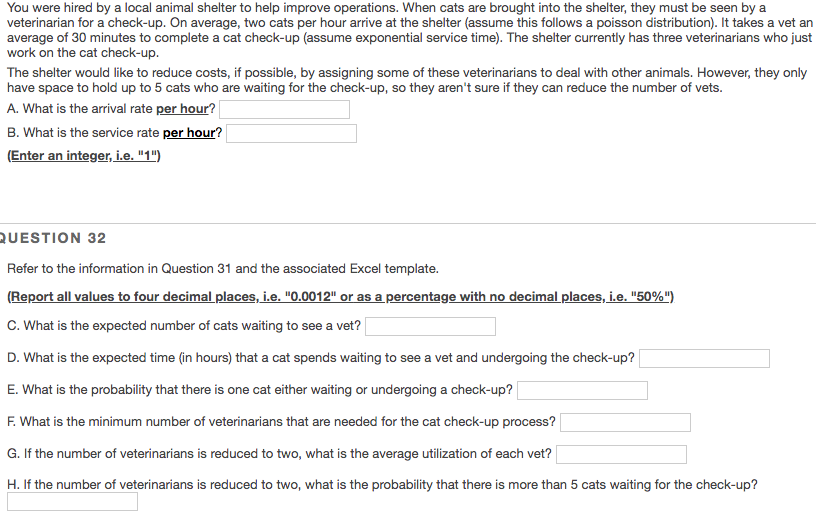
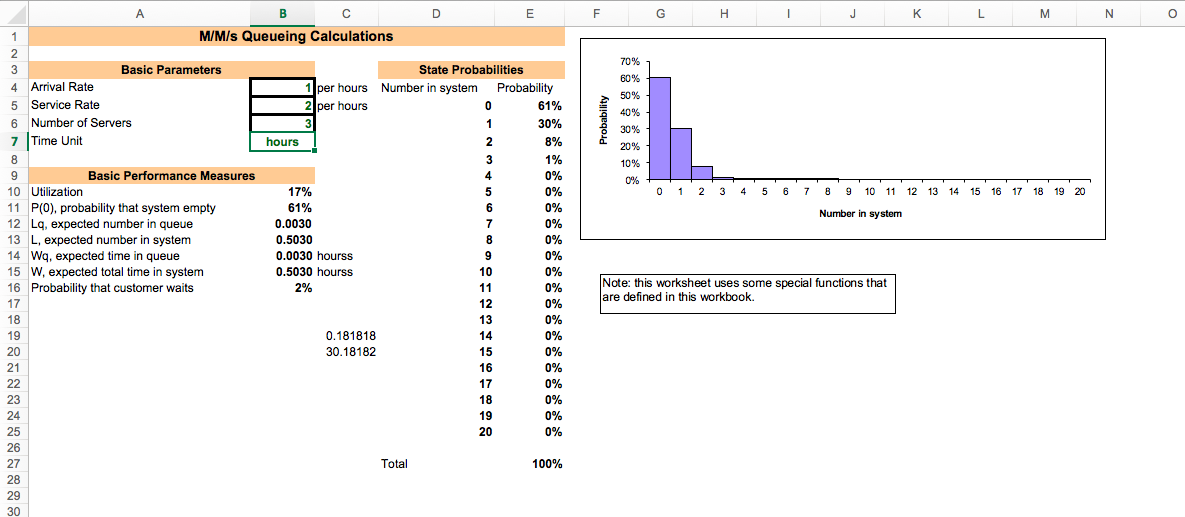
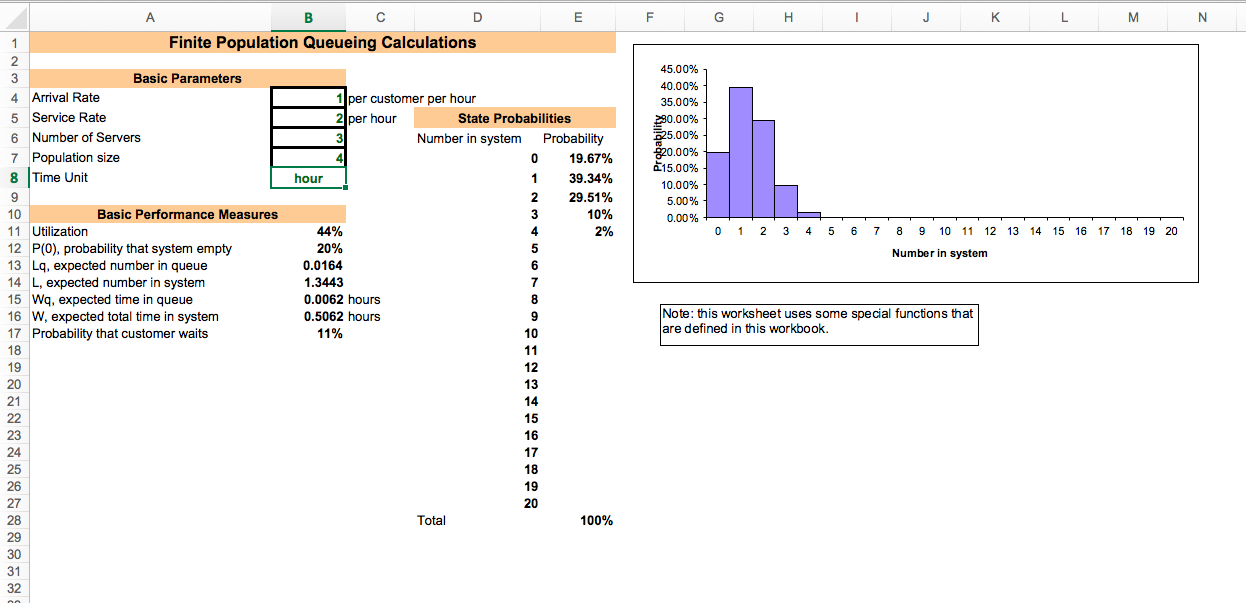
You were hired by a local animal shelter to help improve operations. When cats are brought into the shelter, they must be seen by a veterinarian for a check-up. On average, two cats per hour arrive at the shelter (assume this follows a poisson distribution). It takes a vet an average of 30 minutes to complete a cat check-up (assume exponential service time). The shelter currently has three veterinarians who just work on the cat check-up. The shelter would like to reduce costs, if possible, by assigning some of these veterinarians to deal with other animals. However, they only have space to hold up to 5 cats who are waiting for the check-up, so they aren't sure if they can reduce the number of vets. A. What is the arrival rate per hour? B. What is the service rate per hour? (Enter an integer, i.e. "1") QUESTION 32 Refer to the information in Question 31 and the associated Excel template. (Report all values to four decimal places, i.e. "0.0012" or as a percentage with no decimal places, i.e. "50%") C. What is the expected number of cats waiting to see a vet? D. What is the expected time (in hours) that a cat spends waiting to see a vet and undergoing the check-up? E. What is the probability that there is one cat either waiting or undergoing a check-up? E. What is the minimum number of veterinarians that are needed for the cat check-up process? G. If the number of veterinarians is reduced to two, what is the average utilization of each vet? H. If the number of veterinarians is reduced to two, what is the probability that there is more than 5 cats waiting for the check-up? D E F G H I J K L M N O B C M/M/s Queueing Calculations Basic Parameters 4 Arrival Rate 5 Service Rate 6 Number of Servers 7 Time Unit State Probabilities 1 per hours Number in system Probability 2 per hours 30% 61% Probability hours - 9 = = = = = = = 0 1 2 3 4 5 6 7 12 13 14 15 16 17 18 19 20 8 9 10 11 Number in system Basic Performance Measures 10 Utilization 11 P(O), probability that system empty 12 Lq, expected number in queue 13 L, expected number in system 14 Wq, expected time in queue 15 W, expected total time in system 16 Probability that customer waits 17% 61% 0.0030 0.5030 0.0030 hourss 0.5030 hourss 2% Note: this worksheet uses some special functions that are defined in this workbook. 0.181818 30.18182 0% 0% Total 100% E F B C D Finite Population Queueing Calculations Basic Parameters 4 Arrival Rate Service Rate 6 Number of Servers 7 Population size Time Unit 45.00% 40.00% 35.00% 230.00% 225.00% 220.00% 215.00% 10.00% 5.00% 0.00% 1 per customer per hour 2 per hour State Probabilities Number in system Probability 0 19.67% hour 39.34% 29.51% 10% 44% 20% 0.0164 1.3443 0.0062 hours 0.5062 hours 11% 2% 0 1 2 3 4 5 6 7 13 14 15 16 17 18 19 20 10 Basic Performance Measures 11 Utilization 12 P(O), probability that system empty 13 Lq, expected number in queue 14 L, expected number in system 15 Wq, expected time in queue 16 W, expected total time in system 17 Probability that customer waits 8 9 10 11 12 Number in system Note: this worksheet uses some special functions that are defined in this workbook. Total 100%


