

Question: im posting with more clear images, this is 3rd post of same question and is all my own work. i have used advice given on
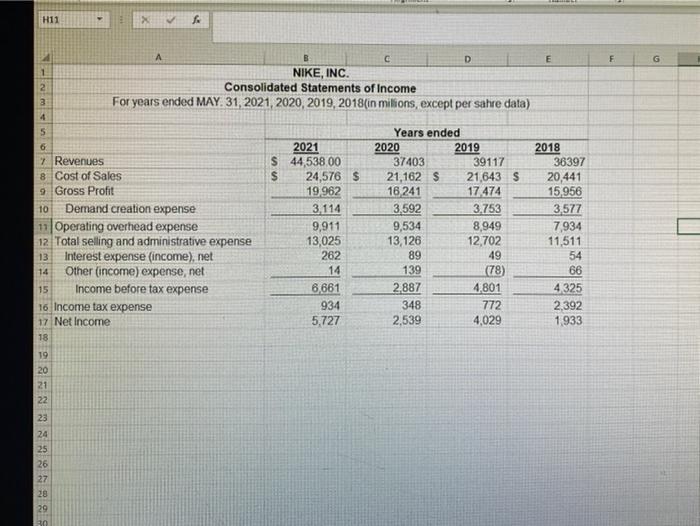
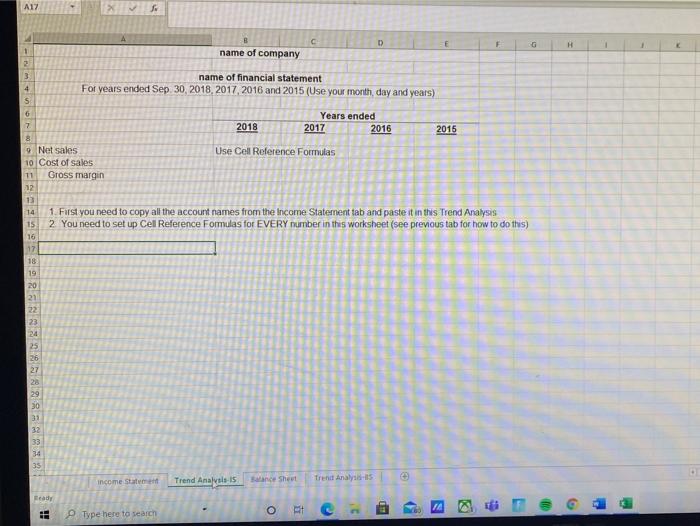
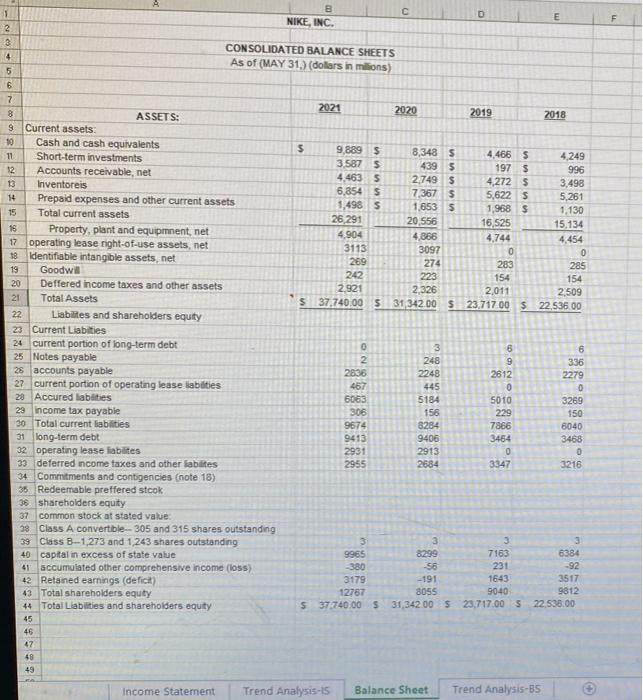
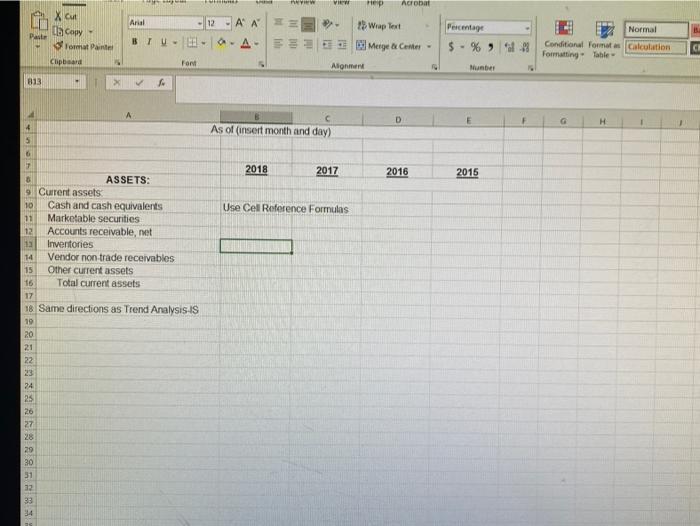
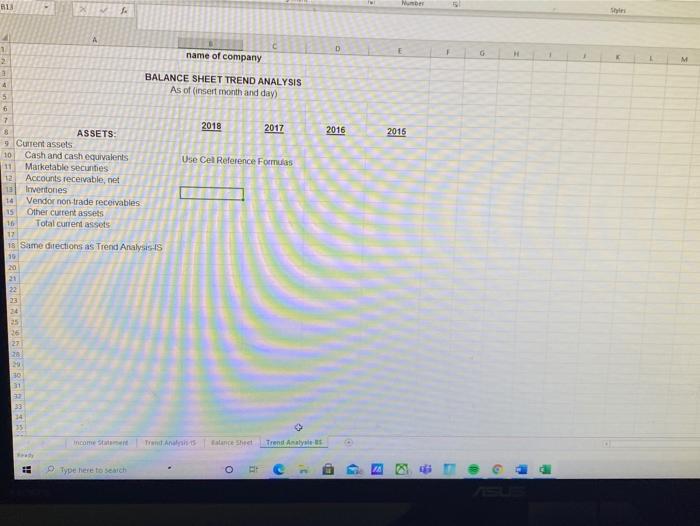
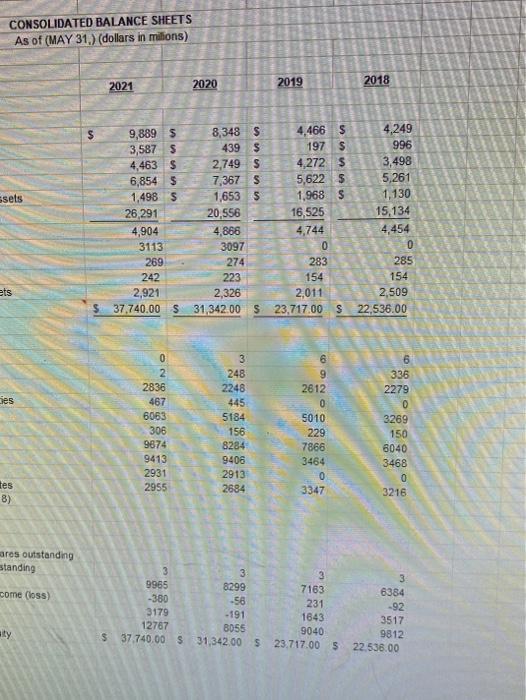
Consolidated Statements of Income as closely as possible. Note: Only incl the part of the company s Income Statement above the EPS calculations. T finished with this section you should have four years of information on on worksheet. All math on the worksheet should be done using Excel - either adding two cells or using SUM for three or more cells. 2. Trend Analysis-IS Tab (one decimal point percentage) a. In the second worksheet you will perform a trend analysis on the company's Income Statement using the oldest (fouth) year as the base year. The trend analysis must be done using Excel cell references to get the appropriate information from the Income Statement entered in the first worksheet. Be sure to label the heading of the report to mclude Income Statement Trend Analysis 3. Balance Sheet Tab a. In the third worksheet of your workbook you will duplicate the company's Consolidated Balance Sheets as closely as possible. When finished with thi section you should have four years of information on one worksheet. All m on the worksheet should be done using Excel - either adding two cells or us SUM for three or more cells, 4. Trend Analysis-BS Tab (one decimal point percentage) a. In the fourth worksheet you will perform a trend analysis on the company's Balance Sheet using the oldest (fouth) year as the base year. The trend analysis must be done using Excel cell references to get the appropriate information from the Balance Sheet entered in the third worksheet. Be sure label the heading of the report to include Balance Sheet Trend Analysis. RUBRIC H11 A E G 3 D E 1 NIKE, INC. 2 Consolidated Statements of Income For years ended MAY 31, 2021 2020, 2019, 2018(in milions, except per sahre data) 4 5 Years ended 6 2021 2020 2019 2018 7 Revenues $ 44,538.00 37403 39117 36397 8 Cost of Sales 24,576 $ 21,162 $ 21,643S 20,441 9 Gross Profit 19 962 16.241 17 474 15,956 10 Demand creation expense 3,114 3,592 3.753 3,577 11 Operating overhead expense 9,911 9,534 8,949 7,934 12 Total selling and administrative expense 13,025 13,126 12,702 11,511 13 Interest expense (income), net 282 89 49 54 14 Other (income) expense, net 14 139 (78) 66 15 Income before tax expense 6,661 2.887 4.801 4325 16 Income tax expense 934 348 772 2,392 17 Net Income 5,727 2,539 4,029 1.933 18 19 20 21 22 23 24 25 26 27 28 29 30 A17 D G H name of company 1 2 3 4 5 name of financial statement For years ended Sep 30, 2018, 2017, 2016 and 2015 (Use your month day and years) 6 7 Years ended 2018 2017 2016 2015 8 9 Net Sales Use Cell Reference Formulas 10 Cost of sales 11 Gross margin 12 13 14 1. First you need to copy all the account names from the Income Statement tab and paste it in this Trend Analysis 15 2 You need to set up Cell Reference Formulas for EVERY number in this worksheet (see previous tab for how to do this) 16 17 18 19 20 21 22 23 24 25 26 27 28 29 30 31 32 33 34 35 Trend Analys income Stat Trend Analysis and short Eeady O 7 c ED - 2 Type here to search A B NIKE, INC. D E 1 2 3 4 5 CONSOLIDATED BALANCE SHEETS As of (MAY 31.) (dollars in milions) 6 2021 7 2020 8 ASSETS: 2019 2018 9 Current assets: 10 Cash and cash equivalents 5 9,889 8,348 11 Short-term investments $ 4,466 5 4,249 3.587 5 439 5 12 Accounts receivable, net 1975 996 4.4635 2.749 $ 13 Inventoreis 4,2725 3,498 6,854 S 7,367 $ 14 Prepaid expenses and other current assets 5,6225 5,261 1,498 5 1.653 5 1,968 5 15 Total current assets 1.130 26.291 20.556 16.525 15,134 16 Property, plant and equipment net 4.904 4,866 4,744 4,454 17 operating lease right-of-use assets, net 3113 3097 0 0 18 Identifiable intangible assets.net 269 274 283 285 19 Goodwill 242 223 154 154 20 Deffered income taxes and other assets 2.921 2,326 2,011 2,509 21 Total Assets $ 37,740.00 5 31 342 00 5 23.717 00 5 22.536.00 22 Liabilites and shareholders equity 23 Current Liabities 24 current portion of long-term debt 0 3 6 6 25 Notes payable 2 248 9 336 25 accounts payable 2836 2248 2612 2279 27 current portion of operating lease labities 467 445 0 0 28 Accured liabilities 6065 5184 5010 3269 29 income tax payable 306 156 229 150 30 Total current abilities 9674 8284 7866 6040 31 long-term debt 9413 9406 3464 3468 32 Operating lease liabilites 2931 2913 0 0 33 deferred income taxes and other abilites 2955 2584 3347 3216 34 Commitments and contigencies (note 18) 35 Redeemable preffered stcok 36 shareholders equity 37 common stock at stated value 38 Class A convertible - 305 and 315 shares outstanding 33 Class B-1,273 and 1 243 shares outstanding 3 3 3 40 capital in excess of state value 9965 8299 7163 6384 41 accumulated other comprehensive income (loss) -380 -56 231 -92 3179 42 Retained earnings (deficit) -191 1643 3517 43 Total shareholders equity 12767 8055 9040 9812 44 Total Liabilities and shareholders equity $ 37,740.00 $ 31,342 00 5 23.717.00 522.535.00 45 46 47 48 49 Income Statement Trend Analysis-15 Balance Sheet Trend Analysis-BS VIEW Acrobat Arial 12 HE - X Cut as Copy Fort Pante ' ' a-A- BTU- 13 Wrap Test Merge Center - Percentage Normal $ - % * Conditional Formes Calculation Formatting Table Clipboard Font Alman Number 813 > H 4 As of (insert month and day) 5 6 7 2018 2017 2016 2015 Use Cell Reference Formulas 0 ASSETS: 9 Current assets 10 Cash and cash equivalents 11 Marketable securities 12 Accounts receivable, net 13 Inventories 14 Vendor non trade receivables 15 Other current assets 16 Total current assets 17 18 Same directions as Trend Analysis IS 19 20 21 22 24 25 26 27 28 29 30 31 33 33 34 BLR Mb D G M 2016 2015 A 1 C name of company 2 3 BALANCE SHEET TREND ANALYSIS As of insert month and day) 5 6 7 2018 2017 8 ASSETS: 5 Current assets 10 Cash and cash equivalents Use Cel Reference Formulas 11 Marketable secunties 12 Accounts receivable, net 15 Inversiones 14 Vendor non-trade receivables 15 Other current assets Total current assets 17 18 Same directions as Trend Analysis IS 19 NO 21 22 23 27 20 30 31 33 34 35 income Trend Anths alance shee Trend Analyse > H Type here to search CONSOLIDATED BALANCE SHEETS As of (MAY 31.) (dollars in milions) 2020 2021 2019 2018 2018 ssets 9,889 5 3,587 5 4,463 $ 6,854 5 1,4985 26,291 4,904 3113 269 242 2,921 $ 37,740.00 $ 8,348 $ 439 $ 2,749 $ 7,367 $ 1,653 5 20,556 4,866 3097 274 223 2,326 31,342.00 S 4,466 S 197 S 4,272 $ 5,622 5 1,968 S 16,525 4,744 0 283 154 2,011 23,717.00 S 4,249 996 3,498 5,261 1,130 15,134 4,454 0 285 154 2,509 22,536.00 ets es 0 2 2836 467 6063 306 9674 9413 2931 2955 3 248 2248 445 5184 156 8284 9406 2913 2684 6 9 2612 0 5010 229 7866 3464 0 3347 6 336 2279 0 3269 150 6040 3468 0 3216 tes 8) ares outstanding standing come (loss) 3 9965 -380 3179 12767 $ 37.740.00 $ -56 3 3 8299 7163 231 -191 1643 8055 9040 31,342.00 $23.717.00 5 3 6384 -92 3517 9812 22.536.00 ity
Step by Step Solution
There are 3 Steps involved in it

Get step-by-step solutions from verified subject matter experts