

Question: I'm Question 9 You are sampling chips. The chips are either good or bad. You are tracking the proportion defective. % For a p-chart, you
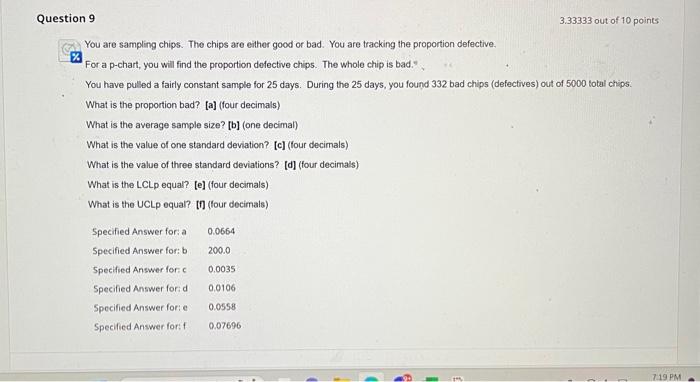
You are sampling chips. The chips are either good or bad. You are tracking the proportion defective. For a p-chart, you will find the proportion defective chips. The whole chip is bad." You have pulled a fairly constant sample for 25 days. During the 25 days, you found 332 bad chips (defectives) out of 5000 total chips. What is the proportion bad? [a] (four decimals) What is the average sample size? [b] (one decimal) What is the value of one standard deviation? [c] (four decimals) What is the value of three standard deviations? [d] (four decimals) What is the LCLp equal? [e] (four decimals) What is the UCLp equal? [f] (four decimals) \begin{tabular}{ll} Specified Answer for: a & 0.0664 \\ Specified Answer for: b & 200.0 \\ Specified Answer for: c & 0.0035 \\ Specified Answer for: d & 0.0106 \\ Specified Answer for: e & 0.0558 \\ Specified Answer for: f & 0.07696 \end{tabular} You are sampling chips. The chips are either good or bad. You are tracking the proportion defective. For a p-chart, you will find the proportion defective chips. The whole chip is bad." You have pulled a fairly constant sample for 25 days. During the 25 days, you found 332 bad chips (defectives) out of 5000 total chips. What is the proportion bad? [a] (four decimals) What is the average sample size? [b] (one decimal) What is the value of one standard deviation? [c] (four decimals) What is the value of three standard deviations? [d] (four decimals) What is the LCLp equal? [e] (four decimals) What is the UCLp equal? [f] (four decimals) \begin{tabular}{ll} Specified Answer for: a & 0.0664 \\ Specified Answer for: b & 200.0 \\ Specified Answer for: c & 0.0035 \\ Specified Answer for: d & 0.0106 \\ Specified Answer for: e & 0.0558 \\ Specified Answer for: f & 0.07696 \end{tabular}
Step by Step Solution
There are 3 Steps involved in it

Get step-by-step solutions from verified subject matter experts