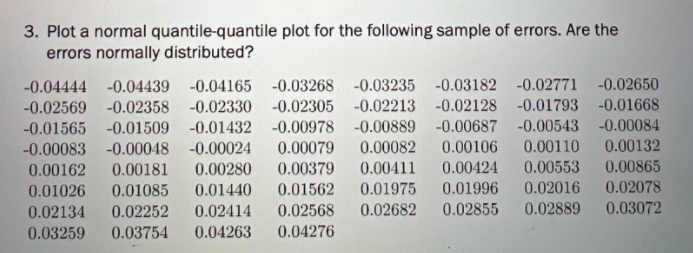
Question: I'm stuck in the question solve this question quickly 3. Plot a normal quantile-quantile plot for the following sample of errors. Are the errors normally

I'm stuck in the question solve this question quickly

I'm stuck in the question solve this question
3. Plot a normal quantile-quantile plot for the following sample of errors. Are the errors normally distributed? -0.04444 -0.04439 -0.04165 -0.03268 -0.03235 -0.03182 -0.02771 -0.02650 -0.02569 -0.02358 -0.02330 -0.02305 -0.02213 -0.02128 -0.01793 -0.01668 -0.01565 -0.01509 -0.01432 -0.00978 -0.00889 -0.00687 -0.00543 -0.00084 -0.00083 -0.00048 -0.00024 0.00079 0.00082 0.00106 0.00110 0.00132 0.00162 0.00181 0.00280 0.00379 0.00411 0.00424 0.00553 0.00865 0.01026 0:01085 0.01440 0.01562 0.01975 0.01996 0.02016 0.02078 0.02134 0.02252 0.02414 0.02568 0.02682 0.02855 0.02889 0.03072 0.03259 0.03754 0.04263 0.04276

Step by Step Solution

There are 3 Steps involved in it

1 Expert Approved Answer
Step: 1 Unlock blur-text-image
Question Has Been Solved by an Expert!

Get step-by-step solutions from verified subject matter experts

Step: 2 Unlock
Step: 3 Unlock

Students Have Also Explored These Related Mathematics Questions!