

Question: I'm trying to figure out how to create a plot of training and test data in R. Please see the problem description below. Graph the
I'm trying to figure out how to create a plot of training and test data in R. Please see the problem description below.
- Graph the training and testing error against the number of trees using a classification random forest model for the presence of heart disease (target) using variables age (age), sex (sex), chest pain type (cp), resting blood pressure (trestbps), cholesterol measurement (chol), resting electrocardiographic measurement (restecg), exercise-induced angina (exang), slope of peak exercise (slope), and number of major vessels (ca). Use a maximum of 200 trees. Use set.seed(511038).
How is this accomplished? Which libraries and plot functions would I use? What would the syntax look like inside the function?
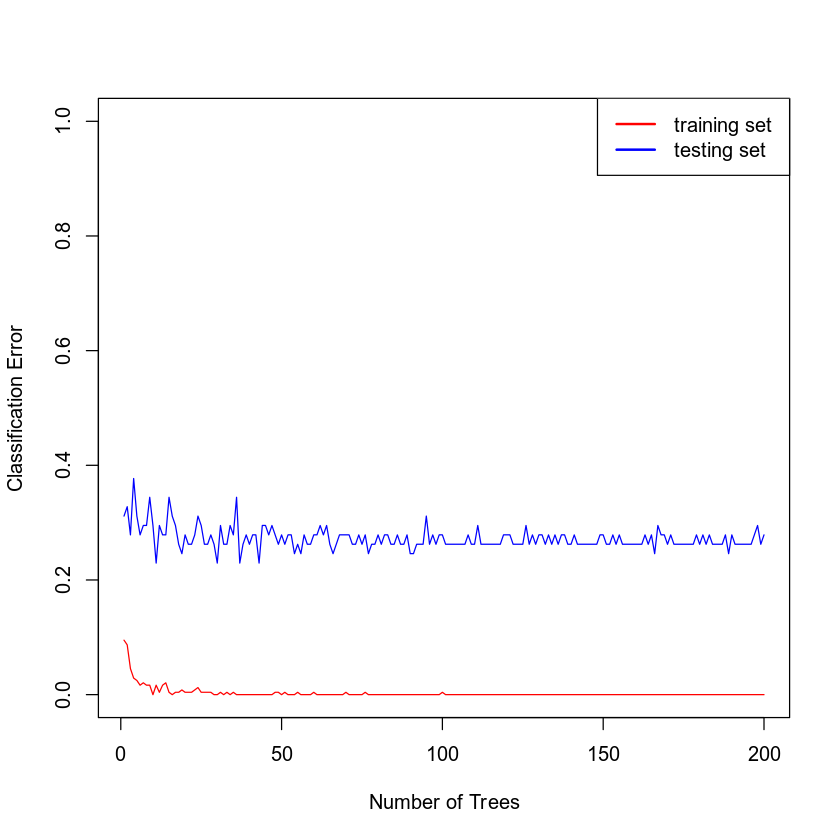
1.0 _ training set testing set 0.8 0.6 Classification Error 0.4 0.2 0.0 m 0 50 100 150 200 Number of Trees
Step by Step Solution
There are 3 Steps involved in it
1 Expert Approved Answer
Step: 1 Unlock

Question Has Been Solved by an Expert!
Get step-by-step solutions from verified subject matter experts
Step: 2 Unlock
Step: 3 Unlock