

Question: I'm trying to plot an iterated function system based on the Barnsley Fern. I received several errors and an empty graph. The fractal is started
I'm trying to plot an iterated function system based on the Barnsley Fern. I received several errors and an empty graph. The fractal is started at point (0,0) and generates new points by using 4 transformations. Any suggestions on how to go around this. I'm new to MATLAB and thanks for any help.
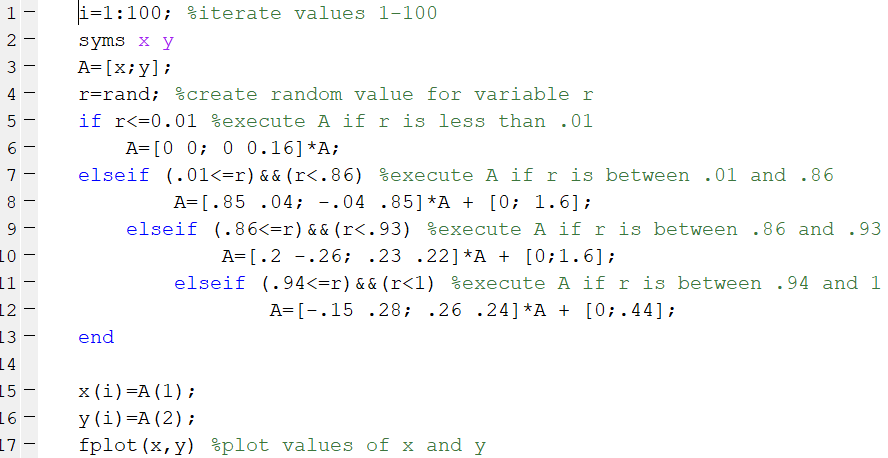
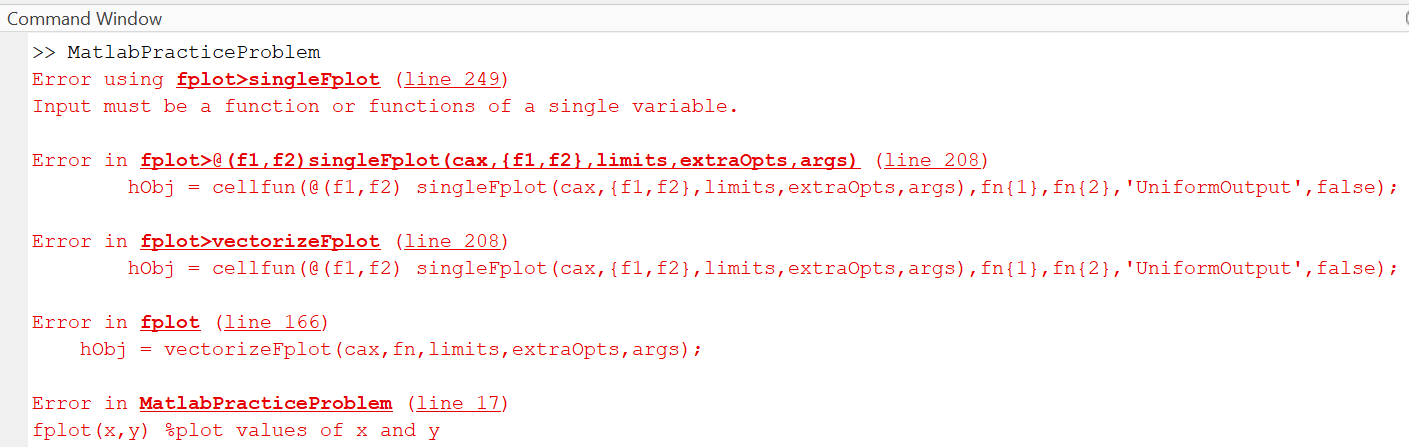
1 - 2- 3 - 4 5 - 6- - 7- 8 - 9- 10 - i=1:100; %iterate values 1-100 syms x y A=[x;y]; r=rand; %create random value for variable r if r> MatlabPractice Problem Error using fplot>singleFplot (line 249) Input must be a function or functions of a single variable. Error in fplot> (f1, f2) singleFplot (cax, {f1, f2} ,limits, extraopts, args) (line 208) hobj = cellfun (@(f1, f2) singleFplot (cax, {f1, f2},limits, extraopts, args), fn{1}, fn{2}, 'Uniformoutput',false); Error in fplot>vectorizeFplot (line 208) hobj = cellfun (@(fl, f2) singleFplot (cax, {f1, f2},limits, extraopts, args), fn{1}, fn{2}, 'Uniformoutput',false); Error in fplot (line 166) hobj = vectorizeFplot (cax, fn,limits, extraopts, args); Error in Matlab Practice Problem (line 17) fplot (x,y) %plot values of x and y
Step by Step Solution
There are 3 Steps involved in it

Get step-by-step solutions from verified subject matter experts