

Question: I'm using RStudio program, I need help with Q4 with finding the mean and standard deviation using (dplyr package functions) for data in a tab-delimited
I'm using RStudio program, I need help with Q4 with finding the mean and standard deviation using (dplyr package functions) for data in a tab-delimited file called mergedData.txt but thus file has some NAs in the columns (missing measurements), also Q5.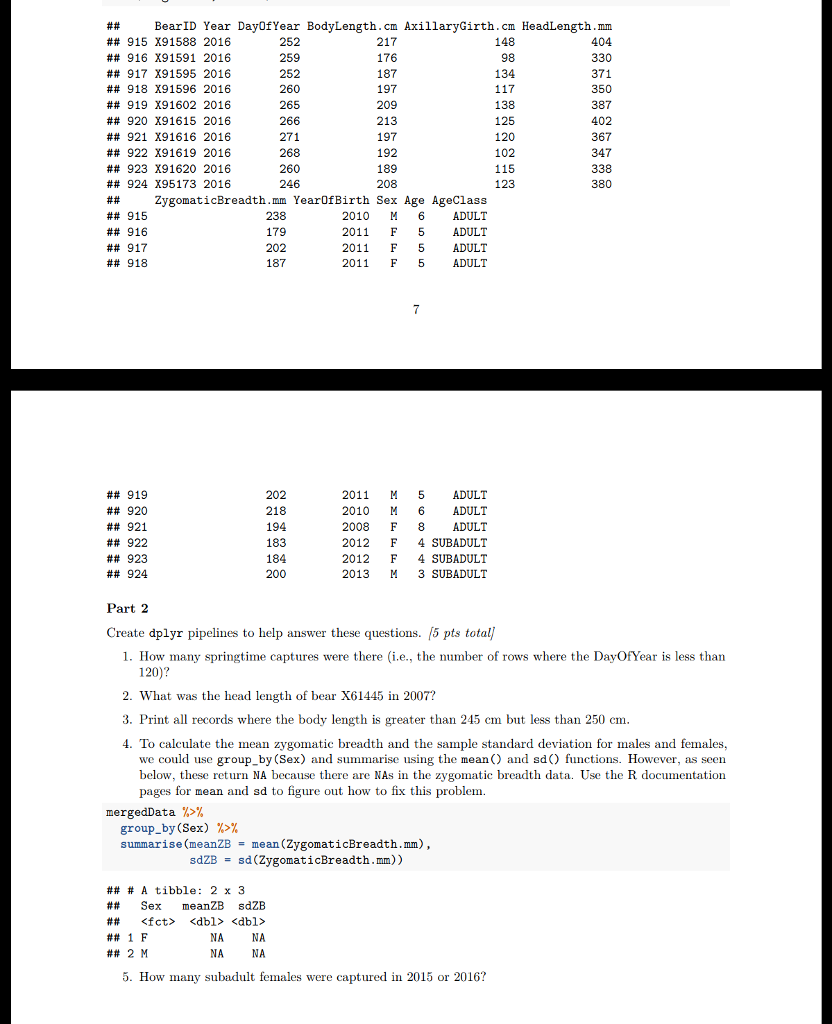
## BearID Year DayDfYear BodyLength.cm AxillaryGirth.cm HeadLength.mm ## 915 X91588 2016 ## 916 X91591 2016 ## 917 X91595 2016 ## 918 X91596 2016 ## 919 X91602 2016 ## 920 X91615 2016 ## 921 X91616 2016 ## 922 X91619 2016 ## 923 X91620 2016 ## 924 X95 173 2016 ## ZygomaticBreadth.mm YearOfBirth Sex Age AgeClass ## 915 ## 916 ## 917 ## 918 252 259 252 260 265 266 271 268 260 246 217 176 187 197 209 213 197 192 148 138 125 120 102 115 123 404 330 371 350 387 402 367 347 338 208 238 179 202 187 2010 M 6ADULT 2011 F 5 ADULT 2011 F 5 ADULT 2011 F 5 ADULT ## 919 ## 920 ## 921 ## 922 ## 923 ## 924 202 194 183 184 200 2011 M 5 ADULT 2010 M 6 ADULT 2008 F 8 ADULT 2012 F 4 SUBADULT 2012 F 4 SUBADULT 2013 M 3 SUBADULT Part 2 Create dplyr pipelines to help answer these questions. [5 pts total How many springtime captures were there .e., the number of rows where the DayOfYear is less tharn 120)? 1. 2. What was the head length of bear X61445 in 2007? 3. Print all records where the body length is greater than 245 cm but less than 250 cm 4. To calculate the mean zygomatic breadth and the sample standard deviation for males and females, we could use group_by (Sex) and summarise using the meanO and sd) functions. However, as seen below, these return NA because there are NAs in the zygomatic breadth data. Use the R documentation pages for mean and sd to figure out how to fix this problem mergedData % group-by (sex) %>% summarise (meanZB = mean (ZygomaticBreadth.mn), sdZB sd (ZygomaticBreadth.mm)) ## # A tibble: 2 x 3 ## Sex meanZB sdZB ##
Step by Step Solution
There are 3 Steps involved in it

Get step-by-step solutions from verified subject matter experts