

Question: I'm working on a statistic project and I'm trying to figure out which team would win if they were placed against each other. The highlighted
I'm working on a statistic project and I'm trying to figure out which team would win if they were placed against each other. The highlighted portion is how many won. Since we are doing sample sizes it's out of 30. The Mami dolphins won 13/30 times and the Dallas Cowboys won 15/30 times. I need to find the P-value of each of these teams. So I would have time make P1-P2=0 the null hypothesis and P1-P2>0 the alternative hypothesis. For the P1-P2 would just be the proportion of wins each team has in a random sample. I need help finding those and the sample size(s), sample mean(s), sample standard deviation(s), number of successes, etc for each of these teams since I know the Standard deviation for the Mami Dolphins is 0.504 and the Standard Deviation for the Dallas Cowboys is 0.5085 Any help is appreciated! I'm just stuck. If you need numerical value for the charts for the win I just assigned (1) and for the losses I assigned (0)
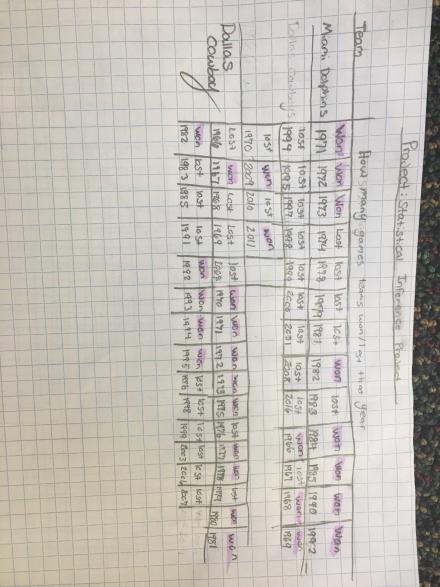
Project : Statistical Inference Project How many games Ihas won/ let that year Want vicel Wen Lost wort Won Wor Won Miami Dolphins 1971 1972 1973 1974 1975 1982 1984 185 1940 1912 TOSE 1051 icat 1994 095 197 1940 1970 IZola Dallas Lost last Can Win cowboy 1464 NTO 1471 wonbest won won wen es lost westlost its 148 3 1815 1941 1292 1413 1614
Step by Step Solution
There are 3 Steps involved in it

Get step-by-step solutions from verified subject matter experts