

Question: Image 1: image 2: Question: using information in image 1, how to get the result for for a tangency portfolio and MV portfolio showed in
Image 1:
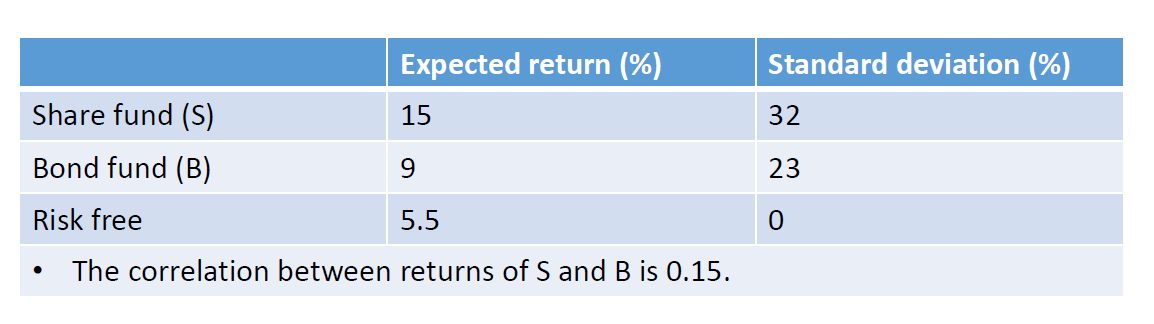
image 2: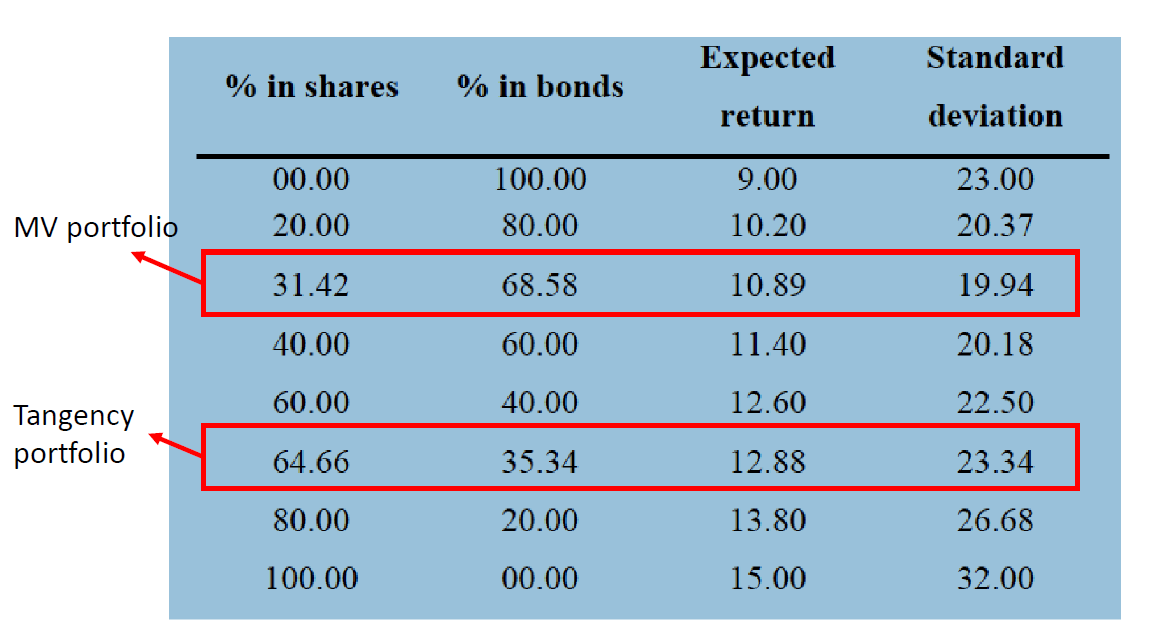
Question: using information in image 1, how to get the result for for a tangency portfolio and MV portfolio showed in image 2? ie, the weights in bond and shares, expected return and standard deviation .
Standard deviation (%) Expected return (%) 15 32 Share fund (S) Bond fund (B) 9 23 Risk free 5.5 0 0 The correlation between returns of S and B is 0.15. Expected Standard % in shares % in bonds return deviation 00.00 20.00 100.00 80.00 9.00 10.20 23.00 20.37 MV portfolio 31.42 68.58 10.89 19.94 40.00 60.00 11.40 20.18 60.00 40.00 12.60 22.50 Tangency portfolio 64.66 35.34 12.88 23.34 80.00 20.00 13.80 26.68 100.00 00.00 15.00 32.00
Step by Step Solution
There are 3 Steps involved in it

Get step-by-step solutions from verified subject matter experts