

Question: Image 1 is the template that may help to solve this problem and it will serve as a guidline 81418lab1.m % I. Representation of a
Image 1 is the template that may help to solve this problem and it will serve as a guidline
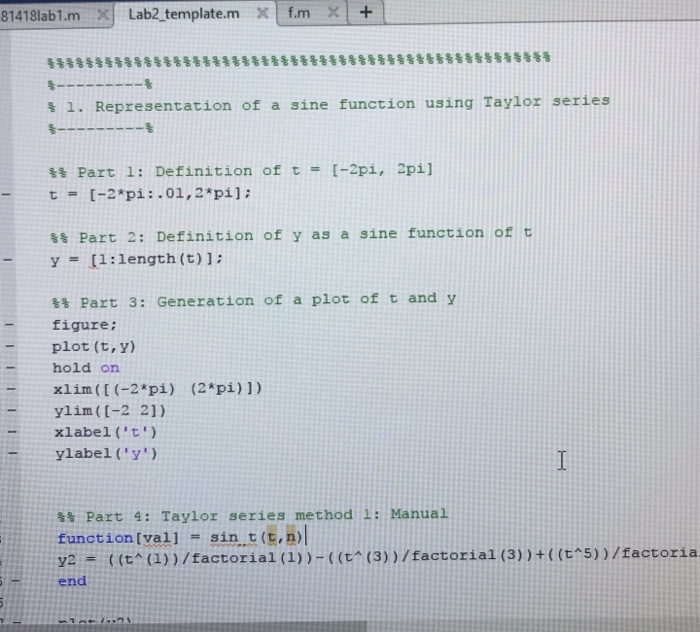
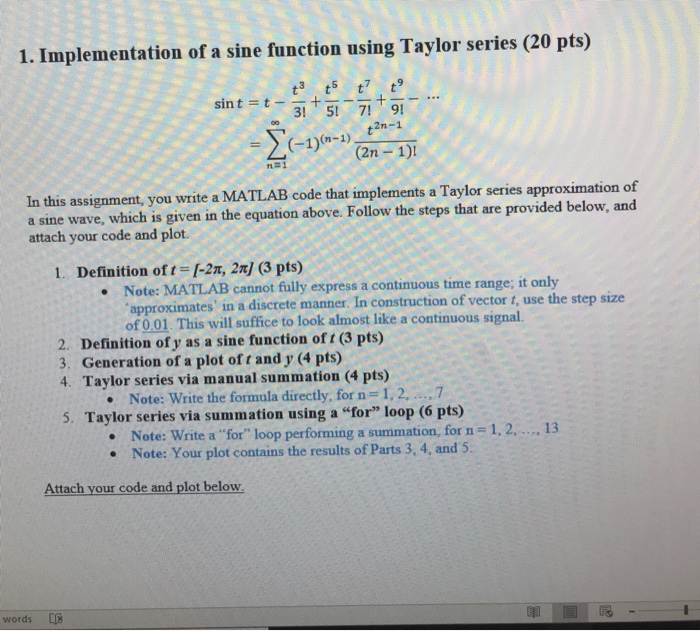
81418lab1.m % I. Representation of a sine function using Taylor series [-2pi, 2pi] %% Part 1: Definition t = [-2*pi: .01,2*pi); of t - %% Part 2: Definition of y as a sine function of t -Y[1:length (t)l: %% Part 3: Generation of a plot of t and y figure: plot (t,y) hold on xlim(t (-2*pi) (2*pi) ]) ylim([-2 2]) xlabel ('t') ylabel ('y') %% Part 4: Taylor series method 1: Manual function [val] = sin t(t,n)! y2 ( (t^ (1) ) /factorial (1) )-( (t"(3) ) /factorial (3) ) + ( (t*S) ) /factora end
Step by Step Solution
There are 3 Steps involved in it
1 Expert Approved Answer
Step: 1 Unlock

Question Has Been Solved by an Expert!
Get step-by-step solutions from verified subject matter experts
Step: 2 Unlock
Step: 3 Unlock