

Question: (Image is in highest quality, zoom in or open image in new tab to see full resolution) Are valuation estimates or the fair price supported
(Image is in highest quality, zoom in or open image in new tab to see full resolution) Are valuation estimates or the fair price supported by future growth and how? [What are the trends in past and projected multiples, and how they compare to those of peers? What is the projected growth trajectory? Is the company growing faster than industry/peers?] Explain after reviewing the following data.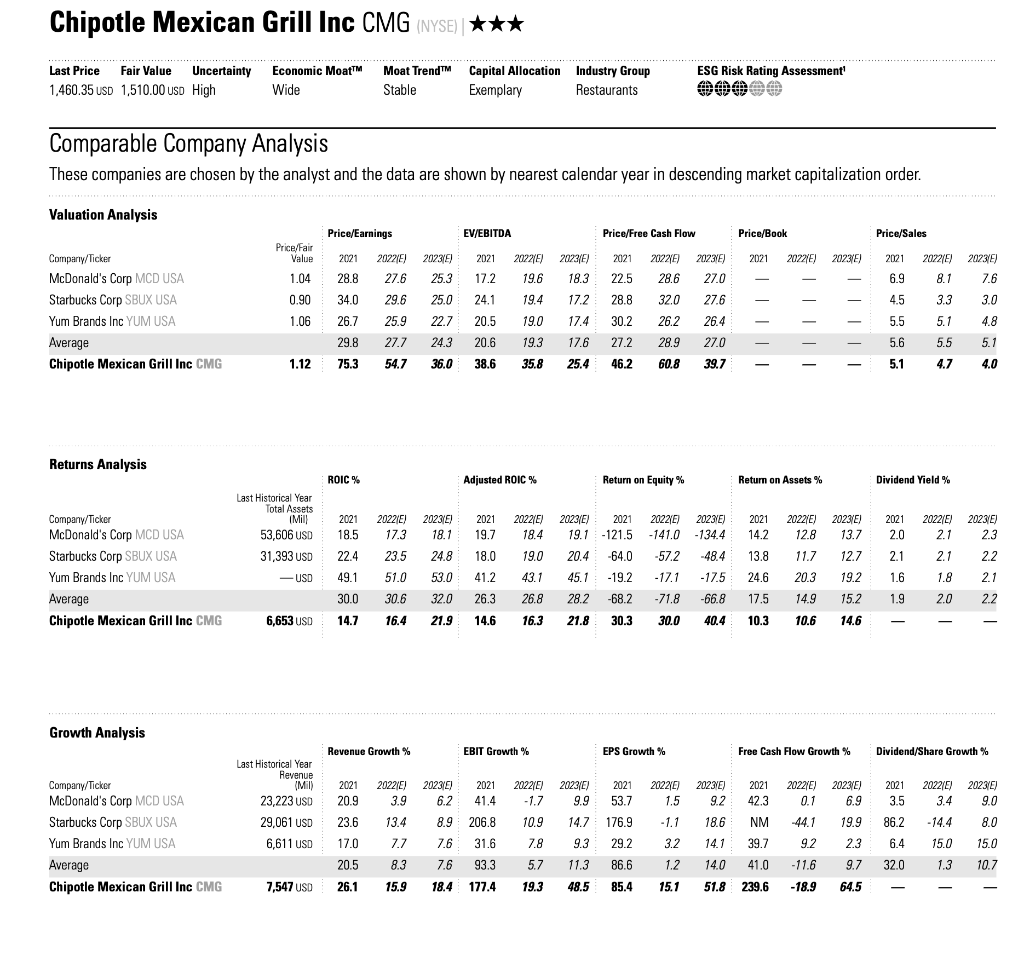
Chipotle Mexican Grill Inc CMG (NYSE)| *** Last Price Fair Value Uncertainty 1.460.35 USD 1,510.00 USD High Economic Moat Wide Moat Trend Capital Allocation Industry Group Stable Exemplary Restaurants ESG Risk Rating Assessment 000 Comparable Company Analysis These companies are chosen by the analyst and the data are shown by nearest calendar year in descending market capitalization order. Valuation Analysis Price/Earnings EV/EBITDA Price/Free Cash Flow Price/Book Price/Sales 2021 202315) 2021 2022/6) 2112210) 2023) 2021 20221E 2023/5) 2021 Price/Fair Value 1.04 0.90 20221) 27.6 29.6 2023/6) 18.3 2021 22.5 25.3 17.2 28.6 28.8 34.0 6.9 19.6 19.4 25.0 24.1 17.2 32.0 Company/Ticker McDonald's Corp MCD USA Starbucks Corp SBUX USA Yum Brands Inc YUM USA Average Chipotle Mexican Grill Inc CMG III 1.06 25.9 2022(E) 2073/E) 8.1 7.6 3.3 3.0 5.1 4.8 5.5 5.1 26.7 29.8 22.7 243 20.5 20.6 28.8 30.2 27.2 19.0 19.3 17.4 17.6 27.0 27.6 26.4 27.0 39.7 26.2 28.9 4.5 5.5 5.6 27.7 1.12 75.3 54.7 36.0 38.6 35.8 25.4 46.2 60.8 I - 5.1 4.7 4.0 Returns Analysis ROIC % Adjusted ROIC % Return on Equity % Return on Assets % Dividend Yield % Last Historical Year Total Assets I Mil! 53,606 USD 31,393 USD 2021 18.5 2022E) 17.3 202315) 18.1 2021 19.7 18.0 2022E) 18.4 2023(E) 2021 19.1 -121.5 20.4 -64.0 20221) -141.0 -57.2 20231E) -134.4 2021 14.2 13.8 2022 E) 12.8 2023/E) 13.7 12.7 2021 2.0 2022(E) 2.1 2023/5) 2.3 22.4 23.5 19.0 -48.4 2.1 2.1 2.2 Company/Ticker McDonald's Corp MCD USA Starbucks Corp SBUX USA Yum Brands Inc YUM USA Average Chipotle Mexican Grill Inc CMG 24.8 53.0 USD 49.1 51.0 43.1 - 17.1 -17.5 24.6 1.6 1.8 11.7 20.3 14.9 41.2 26.3 2.1 45.1 28.2 -19.2 -68.2 19.2 15.2 30.6 32.0 26.8 -71.8 -66.8 17.5 1.9 2.0 2.2 30.0 14.7 6,653 USD 16.4 21.9 14.6 16.3 21.8 30.3 30.0 40.4 10.3 10.6 14.6 Growth Analysis Revenue Growth % EBIT Growth % EPS Growth % Free Cash Flow Growth % Dividend/Share Growth % Last Historical Year Revenue (Mill 23,223 USD 29,061 USD 6,611 USD 2021 20.9 20221E) 3.9 20237) 6.2 2021 41.4 2022/E) -1.7 2023/E) 9.9 2021 53.7 21221) 1.5 2023E) 9.2 2021 42.3 2022/E) 0.1 2023E) 6.9 2021 3.5 2022(E) 3.4 20231E) 9.0 13.4 10.9 14.7 - 1.1 18.6 -44.1 19.9 86.2 - 14.4 Company/Ticker McDonald's Corp MCD USA Starbucks Corp SBUX USA Yum Brands Inc YUM USA Average Chipotle Mexican Grill Inc CMG 8.0 23.6 17.0 20.5 NM 39.7 7.8 9.3 176.9 29.2 86.6 3.2 14.1 9.2 7.7 8.3 2.3 8.9 206.8 7.6 31.6 7.6 93.3 18.4 177.4 6.4 32.0 15.0 1.3 15.0 10.7 5.7 11.3 1.2 14.0 41.0 -11.6 9.7 7,547 USD 26.1 15.9 19.3 48.5 85.4 15.1 51.8 239.6 -18.9 64.5 Chipotle Mexican Grill Inc CMG (NYSE)| *** Last Price Fair Value Uncertainty 1.460.35 USD 1,510.00 USD High Economic Moat Wide Moat Trend Capital Allocation Industry Group Stable Exemplary Restaurants ESG Risk Rating Assessment 000 Comparable Company Analysis These companies are chosen by the analyst and the data are shown by nearest calendar year in descending market capitalization order. Valuation Analysis Price/Earnings EV/EBITDA Price/Free Cash Flow Price/Book Price/Sales 2021 202315) 2021 2022/6) 2112210) 2023) 2021 20221E 2023/5) 2021 Price/Fair Value 1.04 0.90 20221) 27.6 29.6 2023/6) 18.3 2021 22.5 25.3 17.2 28.6 28.8 34.0 6.9 19.6 19.4 25.0 24.1 17.2 32.0 Company/Ticker McDonald's Corp MCD USA Starbucks Corp SBUX USA Yum Brands Inc YUM USA Average Chipotle Mexican Grill Inc CMG III 1.06 25.9 2022(E) 2073/E) 8.1 7.6 3.3 3.0 5.1 4.8 5.5 5.1 26.7 29.8 22.7 243 20.5 20.6 28.8 30.2 27.2 19.0 19.3 17.4 17.6 27.0 27.6 26.4 27.0 39.7 26.2 28.9 4.5 5.5 5.6 27.7 1.12 75.3 54.7 36.0 38.6 35.8 25.4 46.2 60.8 I - 5.1 4.7 4.0 Returns Analysis ROIC % Adjusted ROIC % Return on Equity % Return on Assets % Dividend Yield % Last Historical Year Total Assets I Mil! 53,606 USD 31,393 USD 2021 18.5 2022E) 17.3 202315) 18.1 2021 19.7 18.0 2022E) 18.4 2023(E) 2021 19.1 -121.5 20.4 -64.0 20221) -141.0 -57.2 20231E) -134.4 2021 14.2 13.8 2022 E) 12.8 2023/E) 13.7 12.7 2021 2.0 2022(E) 2.1 2023/5) 2.3 22.4 23.5 19.0 -48.4 2.1 2.1 2.2 Company/Ticker McDonald's Corp MCD USA Starbucks Corp SBUX USA Yum Brands Inc YUM USA Average Chipotle Mexican Grill Inc CMG 24.8 53.0 USD 49.1 51.0 43.1 - 17.1 -17.5 24.6 1.6 1.8 11.7 20.3 14.9 41.2 26.3 2.1 45.1 28.2 -19.2 -68.2 19.2 15.2 30.6 32.0 26.8 -71.8 -66.8 17.5 1.9 2.0 2.2 30.0 14.7 6,653 USD 16.4 21.9 14.6 16.3 21.8 30.3 30.0 40.4 10.3 10.6 14.6 Growth Analysis Revenue Growth % EBIT Growth % EPS Growth % Free Cash Flow Growth % Dividend/Share Growth % Last Historical Year Revenue (Mill 23,223 USD 29,061 USD 6,611 USD 2021 20.9 20221E) 3.9 20237) 6.2 2021 41.4 2022/E) -1.7 2023/E) 9.9 2021 53.7 21221) 1.5 2023E) 9.2 2021 42.3 2022/E) 0.1 2023E) 6.9 2021 3.5 2022(E) 3.4 20231E) 9.0 13.4 10.9 14.7 - 1.1 18.6 -44.1 19.9 86.2 - 14.4 Company/Ticker McDonald's Corp MCD USA Starbucks Corp SBUX USA Yum Brands Inc YUM USA Average Chipotle Mexican Grill Inc CMG 8.0 23.6 17.0 20.5 NM 39.7 7.8 9.3 176.9 29.2 86.6 3.2 14.1 9.2 7.7 8.3 2.3 8.9 206.8 7.6 31.6 7.6 93.3 18.4 177.4 6.4 32.0 15.0 1.3 15.0 10.7 5.7 11.3 1.2 14.0 41.0 -11.6 9.7 7,547 USD 26.1 15.9 19.3 48.5 85.4 15.1 51.8 239.6 -18.9 64.5
Step by Step Solution
There are 3 Steps involved in it

Get step-by-step solutions from verified subject matter experts