

Question: Exhibit 1 ARCADIAN MICROARRAY TECHNOLOGIES, INC. Cash Flow Forecast by Arcadian Management Actual INCOME STATEMENT 2004 2005 2006 2007 2008 2009 2010 2011 2012
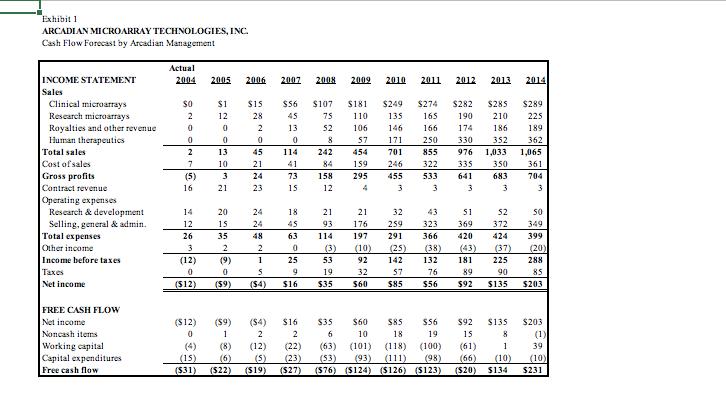
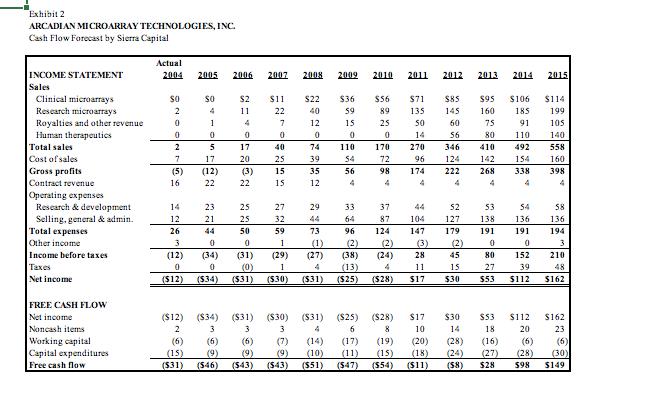
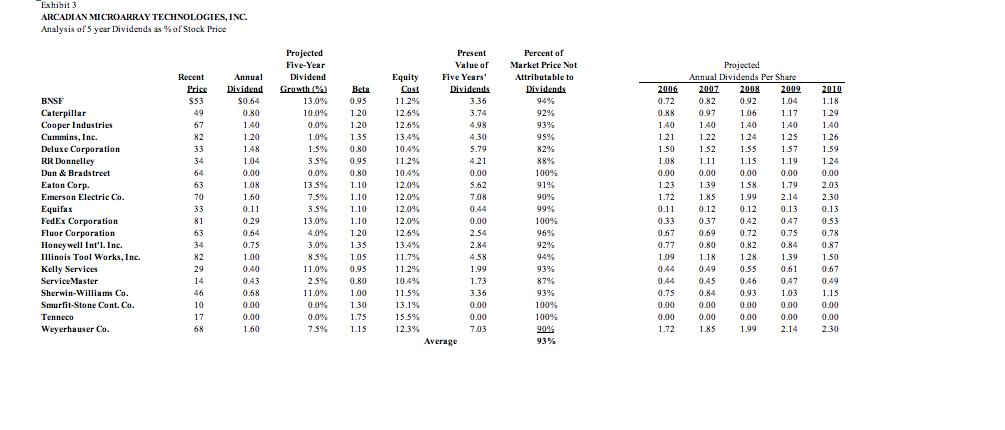
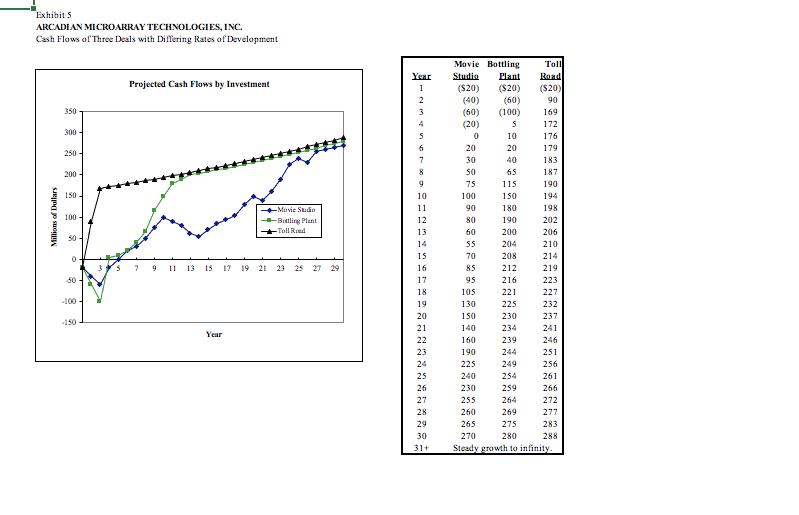
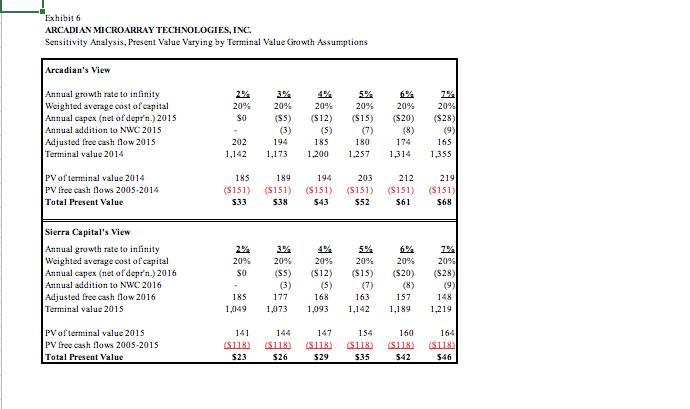
Exhibit 1 ARCADIAN MICROARRAY TECHNOLOGIES, INC. Cash Flow Forecast by Arcadian Management Actual INCOME STATEMENT 2004 2005 2006 2007 2008 2009 2010 2011 2012 2013 2014 Sales Clinical microarrays $0 $1 $15 $56 $107 $181 $249 $274 $282 $285 $289 Research microarrays 2 12 28 45 75 110 135 165 190 210 225 Royalties and other revenue 0 0 2 13 52 106 146 166 174 186 189 Human therapeutics 0 0 0 0 8 57 171 250 330 352 362 Total sales 2 13 45 114 242 454 701 855 976 1,033 1,065 Cost of sales 7 10 21 41 84 159 246 322 335 350 361 Gross profits Contract revenue (5) 3 24 73 158 295 455 533 641 683 704 16 21 23 15 12 4 3 3 3 3 3 Operating expenses Research & development 14 20 24 18 21 21 32 43 51 52 50 Selling, general & admin. 12 15 24 45 93 176 259 323 369 372 349 Total expenses 26 35 48 63 114 197 291 366 420 424 399 Other income 3 2 2 0 (3) (10) (25) (38) (43) (37) (20) Income before taxes (12) (9) 1 25 53 92 142 132 181 225 288 Taxes 0 0 S 9 19. 32 57 76 89 90 85 Net income (512) (59) (54) $16 $35 $60 $85 $56 $92 $135 $203 FREE CASH FLOW Net income (512) (59) (54) $16 $35 $60 $85 $56 $92 $135 $203 Noncash items 0 1 2 2 6 10 18 19 15 8 (1) Working capital (4) (8) (12) (22) (63) (101) (118) (100) (61) 1 39 Capital expenditures (15) (6) (5) (23) (53) (93) (111) (98) (66) (10) (10) Free cash flow ($31) (522) (519) ($27) (576) ($124) ($126) ($123) (520) $134 $231 Exhibit 2 ARCADIAN MICROARRAY TECHNOLOGIES, INC. Cash Flow Forecast by Sierra Capital Actual INCOME STATEMENT 2004 2005 2006 2007 2008 2009 2010 2011 2012 2013 2014 2015 Sales Clinical microarrays SO $0 $2 $11 $22 $36 $56 $71 $85 $95 $106 $114 Research microarrays 2 4 11 22 40 59 89 135 145 160 185 199 Royalties and other revenue 0 1 4 7 12 15 25 50 60 75 91 105 Human therapeutics 0 0 0 0 0 0 0 14 56 801 110 140 Total sales Cost of sales 27 5 17 40 74 110 170 270 346 410 492 558 17 20 25 39 54 72 96 124 142 154 160 Gross profits Contract revenue (5) 16 22 (12) (3) 15 35 56 98 174 222 268 338 398 22 22 15 12 4 4 4 4 4 4 4 Operating expenses Research & development 14 23 25 27 29 33 37 44 52 53 54 58 Selling, general & admin. 12 21 25 32 44 64 87 104 127 138 136 136 Total expenses 26 44 50 59 73 96 124 147 179 191 191 194 Other income 3 0 0 1 (1) (2) (2) (3) (2) 0 0 3 Income before taxes (12) (34) (31) (29) (27) (38) (24) 28 45 80 152 210 Taxes 0 0 (0) 1 4 (13) 4 11 15 27 39 48 Net income (512) (534) (531) (530) (531) ($25) (528) $17 $30 $53 $112 $162 FREE CASH FLOW Net income ($12) ($34) ($31) ($30) ($31) ($25) ($28) $17 $30 $53 $112 $162 Noncash items 2 3 3 3 4 6 8 10 14 18 20 23 Working capital (6) (6) (6) (7) (14) (17) (19) (20) (28) (16) (6) (6) Capital expenditures (15) (9) (9) (9) (10) (11) (15) (18) (24) (27) (28) (30) Free cash flow (531) (546) (543) (543) ($51) (547) (554) ($11) (58) $28 598 $149 Exhibit 3 ARCADIAN MICROARRAY TECHNOLOGIES, INC. Analysis of 5 year Dividends as % of Stock Price Projected Present Percent of Five-Year Value of Market Price Not Projected Recent Annual Dividend Equity Five Years' Attributable to Annual Dividends Per Share Price Dividend Growth (%) Beta Cost Dividends Dividends 2006 2007 2008 2009 2010 BNSF $53 $0.64 13.0% 0.95 11.2% 3.36 94% 0.72 0.82 0.92 1.04 1.18 Caterpillar 49 0.80 10.0% 1.20 12.6% 3.74 92% 0.88 0.97 1.06 1.17 1.29 Cooper Industries 67 1.40 0.0% 1.20 12.6% 4.98 93% 1.40 1.40 1.40 1.40 1.40 Cummins, Inc. 82 1.20 1.0% 1.35 13.4% 4.30 95% 1.21 1.22 1.24 1.25 1.26 Deluxe Corporation 33 1.48 1.5% 0.80 10.4% 5.79 82% 1.50 1.52 1.55 1.57 1.59 RR Donnelley 34 1.04 3.5% 0.95 11.2% 4.21 88% 1.08 1.11 1.15 1.19. 1.24 Dun & Bradstreet 64 0.00 0.0% 0.80 10.4% 0.00 100% 0.00 0.00 0.00 0.00 0.00 Eaton Corp. 63 1.08 13.5% 1.10 12.0% 5.62 91% 1.23 1.39 1.58 1.79 2.03 Emerson Electric Co. 70 1.60 7.5% 1.10 12.0% 7.08 90% 1.72 1.85 1.99 2.14. 2.30 Equifax 33 0.11 3.5% 1.10 12.0% 0.44 99% 0.11 0.12 0.12 0.13 0.13 FedEx Corporation 81 0.29 13.0% 1.10 12.0% 0.00 100% 0.33 0.37 0.42 0.47 0.53 Fluor Corporation 63 0.64 4.0% 1.20 12.6% 2.54 96% 0.67 0.69 0.72 0.75 0.78 Honeywell Int'l. Inc. 34 0.75 3.0% 1.35 13.4% 2.84 92% 0.77 0.80 0.82 0.84 0.87 Illinois Tool Works, Inc. 82 1.00 8.5% 1.05 11.7% 4.58 94% 1.09 1.18 1.28 1.39 1.50 Kelly Services 29 0.40 11.0% 0.95 11.2% 1.99 93% 0.44 0.49 0.55 0.61 0.67 ServiceMaster 14 0.43 2.5% 0.80 10.4% 1.73 87% 0.44 0.45 0.46 0.47 0.49 Sherwin-Williams Co. 46 0.68 11.0% 1.00 11.5% 3.36 93% 0.75 0.84 0.93 1.03 1.15 Smurfit-Stone Cont. Co. 10 0.00 0.0% 1.30 13.1% 0.00 100% 0.00 0.00 0.00 0.00 0.00 Tenneco 17 0.00 0.0% 1.75 15.5% 0.00 100% 0.00 0.00 0.00 0.00 0.00 Weyerhauser Co. 68 1.60 7.5% 1.15 12.3% 7.03 90% 1.72 1.85 1.99 2.14 2.30 Average 93% Millions of Dollars Exhibit 5 ARCADIAN MICROARRAY TECHNOLOGIES, INC. Cash Flows of Three Deals with Differing Rates of Development Movie Bottling Toll Year Studio Plant Road Projected Cash Flows by Investment 1 ($20) ($20) ($20) 2 (40) (60) 90 350 300 250- 200- 3 (60) (100) 169 4 (20) S 172 0 10 176 6 20 20 179 7 30 40 183 8 50 65 187 9 75 115 190 150 10 100 150 194 -Movie Studio 11 90 180 198 100- 50 Battling Plant 12 80 190 202 -Toll Road 13 60 200 206 14 55 204 210 0 15 70 208 214 5 9 11 13 15 17 19 21 23 25 27 29 16 85 212 219 50 17 95 216 223 18 105 221 227 -100 -150 19 130 225 232 20 150 230 237 21 140 234 241 Year 22 160 239 246 23 190 244 251 24 225 249 256 25 240 254 261 26 230 259 266 27 255 264 272 28 260 269 277 29 265 275 283 30 270 280 288 31+ Steady growth to infinity. Exhibit 6 ARCADIAN MICROARRAY TECHNOLOGIES, INC. Sensitivity Analysis, Present Value Varying by Terminal Value Growth Assumptions Arcadian's View Annual growth rate to infinity 2% 3% 4% 5% 6% 7% Weighted average cost of capital 20% 20% 20% 20% 20% 20% Annual capex (net of depr'n.) 2015 $0 ($5) ($12) ($15) ($20) ($28) Annual addition to NWC 2015 (3) (5) (7) (8) (9) Adjusted free cash flow 2015 202 194 185 180 174 165 Terminal value 2014 1,142 1,173 1,200 1,257 1,314 1,355 PV of terminal value 2014 185 189 194 203 212 219 PV free cash flows 2005-2014 ($151) ($151) ($151) ($151) ($151) ($151) Total Present Value $33 $38 $43 $52 $61 $68 Sierra Capital's View Annual growth rate to infinity 2% 3% 4% 5% 6% 7% Weighted average cost of capital 20% 20% 20% 20% 20% 20% Annual capex (net of depr'n.) 2016 (SS) ($12) ($15) ($20) ($28) Annual addition to NWC 2016 (3) (5) (7) (8) (9) Adjusted free cash flow 2016 185 177 168 163 157 148 Terminal value 2015 1,049 1,073 1,093 1,142 1,189 1,219 PV of terminal value 2015 141 144 147 154 160 164 PV free cash flows 2005-2015 ($118) ($118) ($118) (S118) ($118) ($118) Total Present Value $23 $26 529 $35 542 $46
Step by Step Solution
There are 3 Steps involved in it

Get step-by-step solutions from verified subject matter experts