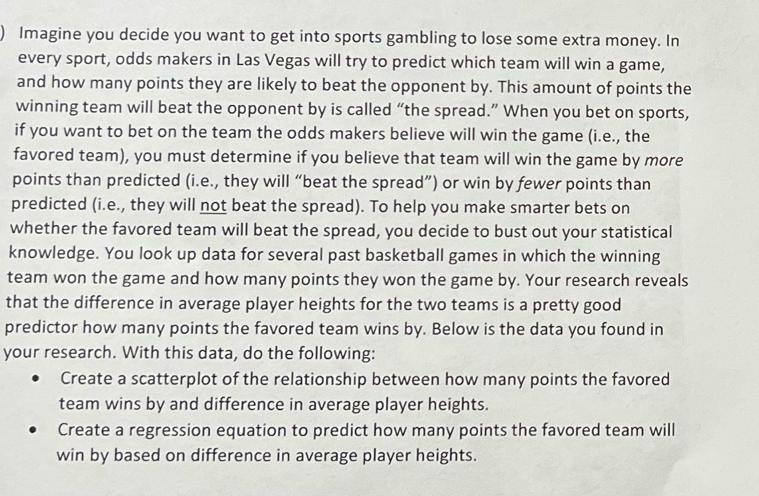
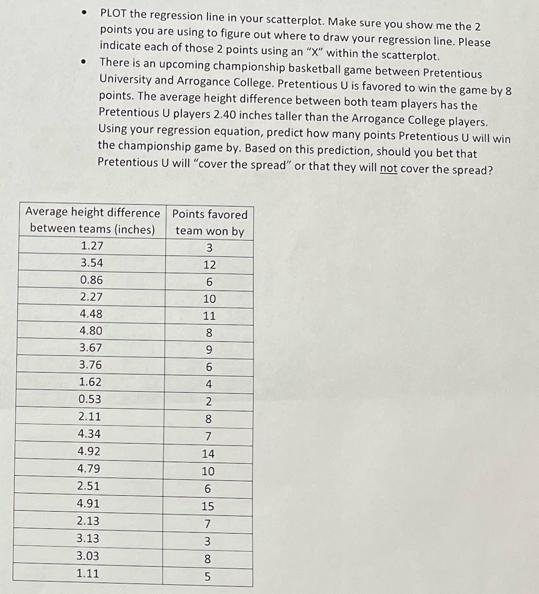
Imagine you decide you want to get into sports gambling to lose some extra money. In...
Fantastic news! We've Found the answer you've been seeking!
Question:
Transcribed Image Text:
Imagine you decide you want to get into sports gambling to lose some extra money. In every sport, odds makers in Las Vegas will try to predict which team will win a game, and how many points they are likely to beat the opponent by. This amount of points the winning team will beat the opponent by is called "the spread." When you bet on sports, if you want to bet on the team the odds makers believe will win the game (i.e., the favored team), you must determine if you believe that team will win the game by more points than predicted (i.e., they will "beat the spread") or win by fewer points than predicted (i.e., they will not beat the spread). To help you make smarter bets on whether the favored team will beat the spread, you decide to bust out your statistical knowledge. You look up data for several past basketball games in which the winning team won the game and how many points they won the game by. Your research reveals that the difference in average player heights for the two teams is a pretty good predictor how many points the favored team wins by. Below is the data you found in your research. With this data, do the following: Create a scatterplot of the relationship between how many points the favored team wins by and difference in average player heights. Create a regression equation to predict how many points the favored team will win by based on difference in average player heights. PLOT the regression line in your scatterplot. Make sure you show me the 2 points you are using to figure out where to draw your regression line. Please indicate each of those 2 points using an "X" within the scatterplot. There is an upcoming championship basketball game between Pretentious University and Arrogance College. Pretentious U is favored to win the game by 8 points. The average height difference between both team players has the Pretentious U players 2.40 inches taller than the Arrogance College players. Using your regression equation, predict how many points Pretentious U will win the championship game by. Based on this prediction, should you bet that Pretentious U will "cover the spread" or that they will not cover the spread? Average height difference between teams (inches) Points favored team won by 1.27 3 3.54 12 0.86 6 2.27 10 4.48 11 4.80 8 3.67 9 3.76 6 1.62 4 0.53 2 2.11 8 4.34 7 4.92 14 4.79 10 2.51 6 4.91 15 2.13 7 3.13 3 3.03 8 1.11 5 Imagine you decide you want to get into sports gambling to lose some extra money. In every sport, odds makers in Las Vegas will try to predict which team will win a game, and how many points they are likely to beat the opponent by. This amount of points the winning team will beat the opponent by is called "the spread." When you bet on sports, if you want to bet on the team the odds makers believe will win the game (i.e., the favored team), you must determine if you believe that team will win the game by more points than predicted (i.e., they will "beat the spread") or win by fewer points than predicted (i.e., they will not beat the spread). To help you make smarter bets on whether the favored team will beat the spread, you decide to bust out your statistical knowledge. You look up data for several past basketball games in which the winning team won the game and how many points they won the game by. Your research reveals that the difference in average player heights for the two teams is a pretty good predictor how many points the favored team wins by. Below is the data you found in your research. With this data, do the following: Create a scatterplot of the relationship between how many points the favored team wins by and difference in average player heights. Create a regression equation to predict how many points the favored team will win by based on difference in average player heights. PLOT the regression line in your scatterplot. Make sure you show me the 2 points you are using to figure out where to draw your regression line. Please indicate each of those 2 points using an "X" within the scatterplot. There is an upcoming championship basketball game between Pretentious University and Arrogance College. Pretentious U is favored to win the game by 8 points. The average height difference between both team players has the Pretentious U players 2.40 inches taller than the Arrogance College players. Using your regression equation, predict how many points Pretentious U will win the championship game by. Based on this prediction, should you bet that Pretentious U will "cover the spread" or that they will not cover the spread? Average height difference between teams (inches) Points favored team won by 1.27 3 3.54 12 0.86 6 2.27 10 4.48 11 4.80 8 3.67 9 3.76 6 1.62 4 0.53 2 2.11 8 4.34 7 4.92 14 4.79 10 2.51 6 4.91 15 2.13 7 3.13 3 3.03 8 1.11 5
Expert Answer:
Related Book For
Microeconomics An Intuitive Approach with Calculus
ISBN: 978-0538453257
1st edition
Authors: Thomas Nechyba
Posted Date:
Students also viewed these mathematics questions
-
Planning is one of the most important management functions in any business. A front office managers first step in planning should involve determine the departments goals. Planning also includes...
-
Gambling on Sporting Events: Some people gamble on sporting events strictly to make money while others care directly about which teams win quite apart from whether or not they gambled on the game. A....
-
Draw a graph showing the marginal revenue (MR) and marginal cost (MC) of increasing the tax rate (t) in the Peltzman model of regulation represented by equation (19.1). Place the tax rate on the...
-
Consider the following four equations: 1) 1 = 1 2) 2 + 3+ 4= 1 + 8 3) 5 + 6 + 7 + 8 + 9 = 8 + 27 4) 10 + 11 + 12 + 13 + 14 + 15 + 16 = 27 + 64 Conjecture the general formula suggested by these four...
-
The rectangular horn antenna is used for receiving microwaves. Determine the location x of its center of gravity G. The horn is made of plates having a constant thickness and density and is open at...
-
A company wishes to hedge its exposure to a new fuel whose price changes have a 0.6 correlation with gasoline futures price changes. The company will lose $1 million for each 1 cent increase in the...
-
Swartz Publishing identified the following overhead activities, their respective costs, and their cost drivers to produce the three types of textbooks the company publishes. Deluxe textbooks are made...
-
Consider the region R on Earth including points whose coordinates, when rounded to a whole number of seconds, round to 1233'8" N, 8843'11" W. Determine with justification the perimeter of region R.
-
The following information pertains to Cheng Company. Assume that all statement of financial position amounts represent both average and ending balance figures. Assume that all sales were on credit....
-
Describe the change and innovation processes in criminal justice organizations. Are the strategies used considered effective? Why or why not? What recommendations would you make to achieve maximum...
-
You purchased a machine for $50,000, used it for 10 years, and then sold it for $5000. It cost $2000 per year for maintenance and repairs. You made a profit of $12,000 per year from the machine's...
-
Briefly about Hooker furniture and show reference links? Can you show The dynamic capabilities of the Hooker furniture and its value propositions? Hooker furniture in the furniture & living industry...
-
Describe management, organization, and leadership in relation to criminal justice organizations. What are the main differences between management and leadership? How do managers and leaders have...
-
Vector A is 6.0 units long at a 53 angle with respect to the positive x-axis. Vector B is 12.6 units long at an angle of 2050. Determine the difference between the vectors, C = A - B in terms of...
-
A carbon atom is most likely to form what kind of bond(s) with other atoms?
-
Explain the term "Equivalent Units". Why are they calculated in process costing? [4 Marks] [minimum 350 words]
-
True or False: When dealing with multiple alternatives having unequal lives, the planning horizon equals the least common multiple of lives.
-
For each of the following categories, describe some of the difficulties that you would face in estimating appropriate values to be used in conducting an economic analysis. a. Cash flows b. MARR c....
-
Given the following information about sources of capital, what is the appropriate weighted average cost of capital to use in determining MARR? a. 9.87 percent b. 10.55 percent c. 12.42 percent d....
Study smarter with the SolutionInn App