

Question: Imagine you're creating a computer program that simulates the motion of a ball bouncing on the ground until it comes to a stop. Here are
Imagine you're creating a computer program that simulates the motion of a ball bouncing on the ground until it comes to a stop.
Here are the key details:
The simulation happens on a flat surface, with coordinates in three dimensions: x y and z
You'll start the simulation by launching a ball with a certain speed, angle, and direction.
Parameters you'll use:
Starting Speed: How fast the ball is initially moving.
Starting Bearing: The angle at which the ball is launched from the horizontal.
Starting Trajectory: The angle at which the ball is launched from the vertical.
Bounce Percentage: How much energy is retained when the ball bounces.
Drag Rate: How much speed is lost when the ball is in contact with the ground.
Ground Threshold: The height at which the ball is considered to be on the ground.
Time Interval: The duration of each time step in the simulation.
The ball starts from a height of meters.
You'll use vectors to represent the ball's direction and speed. A vector is like an arrow indicating both direction and magnitude.
At each time step, you'll calculate the ball's movement and update its position.
You'll also consider forces like gravity and drag from the ground to update the ball's velocity.
If the ball bounces, its velocity and position change accordingly.
The simulation ends when the ball hits the ground and stops moving much.
Your task is to code this simulation and plot the following:
Distance traveled over time.
Ball's path from side view xposition vs zposition
Height over time.
Ball's path from topdown view xposition vs yposition
D plot showing the ball's path.
Velocity over time.
Trajectory over time.
You'll use specific parameters for the simulation: bounce percentage of drag rate of ground threshold of and time interval of Try different values for speed, bearing, and trajectory to see where the ball stops, aiming for an xvalue close to meters. can you start with this code import matplotlib.pyplot as plt
import math
import astropy.coordinates
#Takes a D vector, and returns a tuple of the x y and z components
def sphericaltocomponentsmagnitude bearing, trajectory:
return astropy.coordinates.sphericaltocartesianmagnitude math.radianstrajectory math.radiansbearing
#Takes the x y and z components of a D vector, and returns a tuple of magnitude, bearing, and trajectory
def componentstosphericalx y z:
magnitude, trajectory, bearing astropy.coordinates.cartesiantosphericalx y z
return magnitude, math.degreesbearingtovalue math.degreestrajectorytovalue
#Takes two D vectors each specified by magnitude, bearing, and trajectory and returns a
#tuple representing the sum of the two vectors
def addsphericalvectorsmagnitude bearing trajectory magnitude bearing trajectory:
x y z sphericaltocomponentsmagnitude bearing trajectory
x y z sphericaltocomponentsmagnitude bearing trajectory
return componentstosphericalx x y y z and can you use the approach used in this code import matplotlib.pyplot as plt
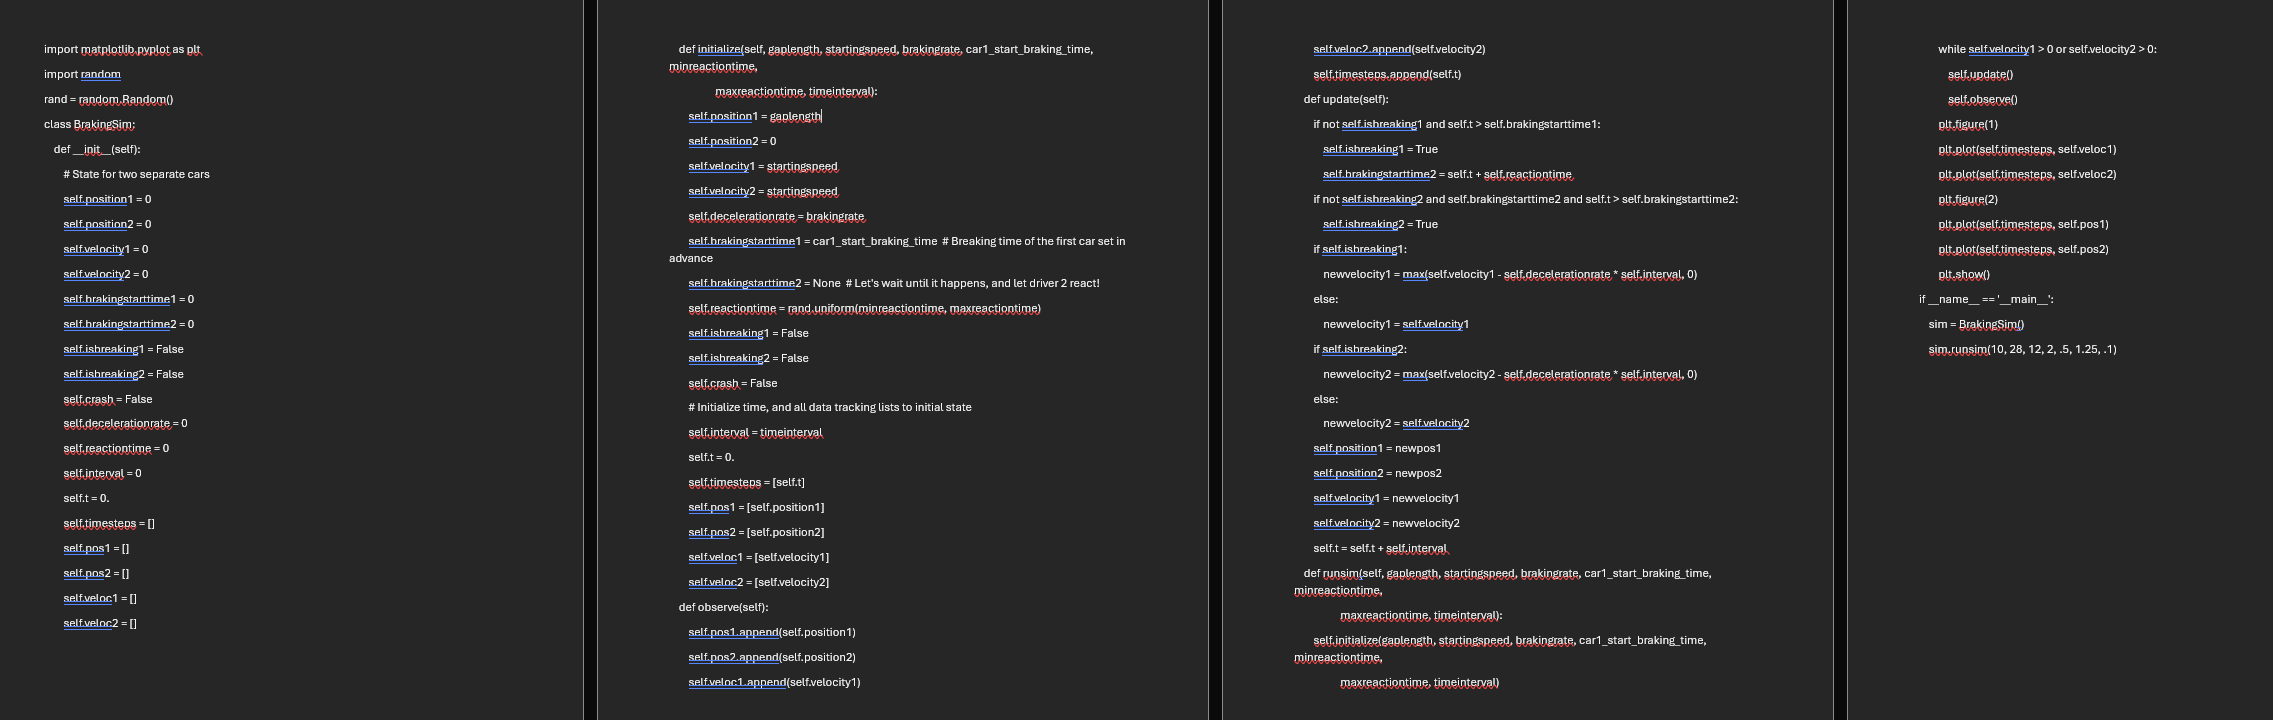
class SimpleDTSim:
def initself:
# You might want to initialize the simulation here, but that means that you will initialize when the
# object is created, rather than on every simulation run
self.x
self.a
self.result
def initializeself startingx a:
self.x startingx
self.a a
self.result selfx
def observeself:
self.result.appendselfx
def updateself:
self.x self.a self.x
def runsimself x a steps:
self.initializex a
for t in rangesteps:
self.update
self.observe
pltplotselfresult
pltshow
if namemain:
sim SimpleDTSim
sim.runsim or the one attached on the screenshot like i want the code to have the same def functions like, init def initializeself def observeself def updateself def runsimself if namemain
Step by Step Solution
There are 3 Steps involved in it
1 Expert Approved Answer
Step: 1 Unlock

Question Has Been Solved by an Expert!
Get step-by-step solutions from verified subject matter experts
Step: 2 Unlock
Step: 3 Unlock