

Question: Implement histogram bin width optimization from a data set. You will use the histogram function in matplotlib.pyplot, accessed as matplotlib.pyplot.hist or plt.hist if you import
Implement histogram bin width optimization from a data set. You will use the histogram function in matplotlib.pyplot, accessed as matplotlib.pyplot.hist or plt.hist if you import matplotlib.pyplot as plt. I need these functions written in python. Please help me fill in those functions. 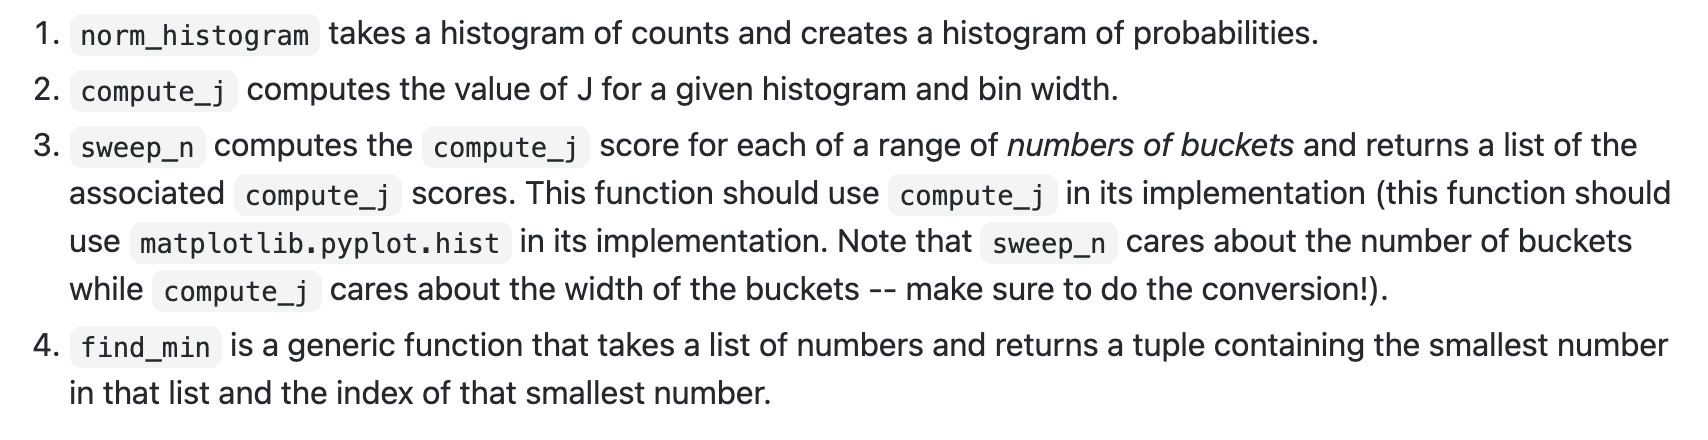
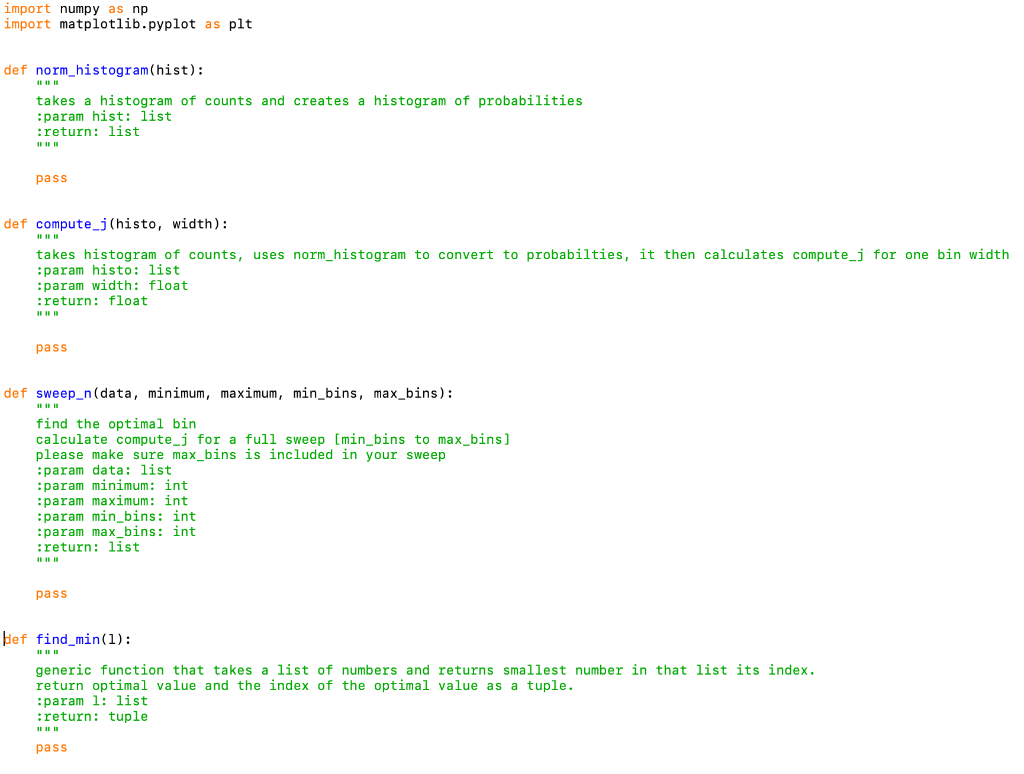
1. norm_histogram takes a histogram of counts and creates a histogram of probabilities. 2. compute_j computes the value of J for a given histogram and bin width. 3. sweep_n computes the compute_j score for each of a range of numbers of buckets and returns a list of the associated compute_j scores. This function should use compute_j in its implementation (this function should use matplotlib.pyplot.hist in its implementation. Note that sweep_n cares about the number of buckets while compute_j cares about the width of the buckets make sure to do the conversion!). 4. find_min is a generic function that takes a list of numbers and returns a tuple containing the smallest number in that list and the index of that smallest number. import numpy as np import matplotlib.pyplot as plt def norm_histogram(hist): probabilities takes a histogram of counts and creates a histogram :param hist: list :return: list pass def compute_j(histo, width): takes histogram of counts, uses norm_histogram to convert to probabilties, it then calculates compute_j for one bin width :param histo: list param width: float :return: float pass def sweep_n(data, minimum, maximum, min_bins, max_bins): find the optimal bin calculate compute_j for a full sweep [min_bins to max_bins] please make sure max_bins is included in your sweep :param data: list :param minimum: int :param maximum: int :param min_bins: int :param max_bins: int :return: list pass Hlef find_min(1): generic function that takes a list of numbers and returns smallest number in that list its index. return optimal value and the index of the optimal value as a tuple. :param 1: list :return: tuple pass 1. norm_histogram takes a histogram of counts and creates a histogram of probabilities. 2. compute_j computes the value of J for a given histogram and bin width. 3. sweep_n computes the compute_j score for each of a range of numbers of buckets and returns a list of the associated compute_j scores. This function should use compute_j in its implementation (this function should use matplotlib.pyplot.hist in its implementation. Note that sweep_n cares about the number of buckets while compute_j cares about the width of the buckets make sure to do the conversion!). 4. find_min is a generic function that takes a list of numbers and returns a tuple containing the smallest number in that list and the index of that smallest number. import numpy as np import matplotlib.pyplot as plt def norm_histogram(hist): probabilities takes a histogram of counts and creates a histogram :param hist: list :return: list pass def compute_j(histo, width): takes histogram of counts, uses norm_histogram to convert to probabilties, it then calculates compute_j for one bin width :param histo: list param width: float :return: float pass def sweep_n(data, minimum, maximum, min_bins, max_bins): find the optimal bin calculate compute_j for a full sweep [min_bins to max_bins] please make sure max_bins is included in your sweep :param data: list :param minimum: int :param maximum: int :param min_bins: int :param max_bins: int :return: list pass Hlef find_min(1): generic function that takes a list of numbers and returns smallest number in that list its index. return optimal value and the index of the optimal value as a tuple. :param 1: list :return: tuple pass
Step by Step Solution
There are 3 Steps involved in it

Get step-by-step solutions from verified subject matter experts