

Question: Implement MAE, RMSE, R2 The first thing we need to do is implement the standard error measures used in regression. You can find the definitions
Implement MAE, RMSE, R2
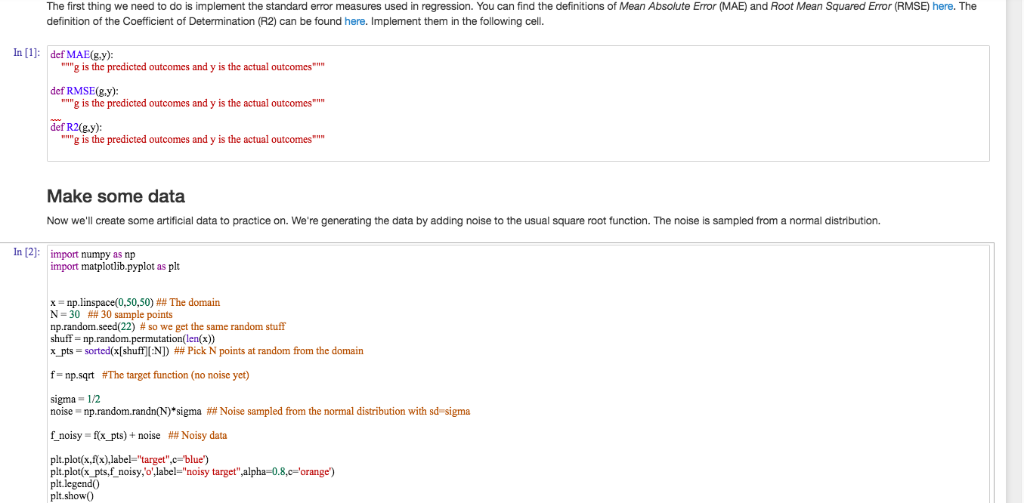
The first thing we need to do is implement the standard error measures used in regression. You can find the definitions of Mean Absolute Error (MAE) and Root Mean Squared Error (RMSE) here. The definition of the Coefficient of Determination (R2) can be found here. Implement them in the following cell. In [1] def MAE(ey) i" g is the predicted outcomes and y is the actual outcomes "g is the predicted outcomes and y is the actual outcomes "g is the predicted outcomes and y is the actual outcomes def RMSE(g.y): def R2(g.y): Make some data Now we'll create some artificial data to practice on. We're generating the data by adding noise to the usual square root function. The noise is sampled from a normal distribution. import numpy as np In [2]: import matplotlib.pyplot as plt x-np.linspace(0.50.50) ## The domain N-30 ## 30 sample points np.random.seed(22) # so we get the same random stuff x_pts-sorted(x[shuffl:N]) ## Pick N points at random from the domain f np.sqrt #The target function (no noise yet) sigma 1/2 noise-mprandom.randn(N)" sigma ## Noise sampled from the normal distribution with sd-sigma f noisy-i(x pts) + noise plt.plotx,fx)abel target"c blue') ## Noisy data plt plot(x pts,f noisy,o'label-"noisy target",alpha-0.8,c orange) plt.show0 The first thing we need to do is implement the standard error measures used in regression. You can find the definitions of Mean Absolute Error (MAE) and Root Mean Squared Error (RMSE) here. The definition of the Coefficient of Determination (R2) can be found here. Implement them in the following cell. In [1] def MAE(ey) i" g is the predicted outcomes and y is the actual outcomes "g is the predicted outcomes and y is the actual outcomes "g is the predicted outcomes and y is the actual outcomes def RMSE(g.y): def R2(g.y): Make some data Now we'll create some artificial data to practice on. We're generating the data by adding noise to the usual square root function. The noise is sampled from a normal distribution. import numpy as np In [2]: import matplotlib.pyplot as plt x-np.linspace(0.50.50) ## The domain N-30 ## 30 sample points np.random.seed(22) # so we get the same random stuff x_pts-sorted(x[shuffl:N]) ## Pick N points at random from the domain f np.sqrt #The target function (no noise yet) sigma 1/2 noise-mprandom.randn(N)" sigma ## Noise sampled from the normal distribution with sd-sigma f noisy-i(x pts) + noise plt.plotx,fx)abel target"c blue') ## Noisy data plt plot(x pts,f noisy,o'label-"noisy target",alpha-0.8,c orange) plt.show0
Step by Step Solution
There are 3 Steps involved in it

Get step-by-step solutions from verified subject matter experts