

Question: import matplotlib.pyplot as plt import numpy as np data = {'Countries': [11.3, 7, 41, 12.5, 17.5, 28, 19.1, 23, 61]} df = pd.DataFrame(data,columns=['Recycling Rate'], index
import matplotlib.pyplot as plt
import numpy as np
data = {'Countries': [11.3, 7, 41, 12.5, 17.5, 28, 19.1, 23, 61]}
df = pd.DataFrame(data,columns=['Recycling Rate'], index = ['Brunie Darussalam', 'Indonesia', 'Cambodia', 'Timor-Leste', 'Malaysia', 'Philippines', 'Thailand', 'Vietnam', 'Singapore'])
df.plot.barh()
plt.title('The Recycling Rate in Southeast Asian Countries')
plt.ylabel('Countries')
plt.xlabel('Recycling Rate')
plt.show()
I'm not sure why it doesn't show me its number on the graph. What's wrong with this?? 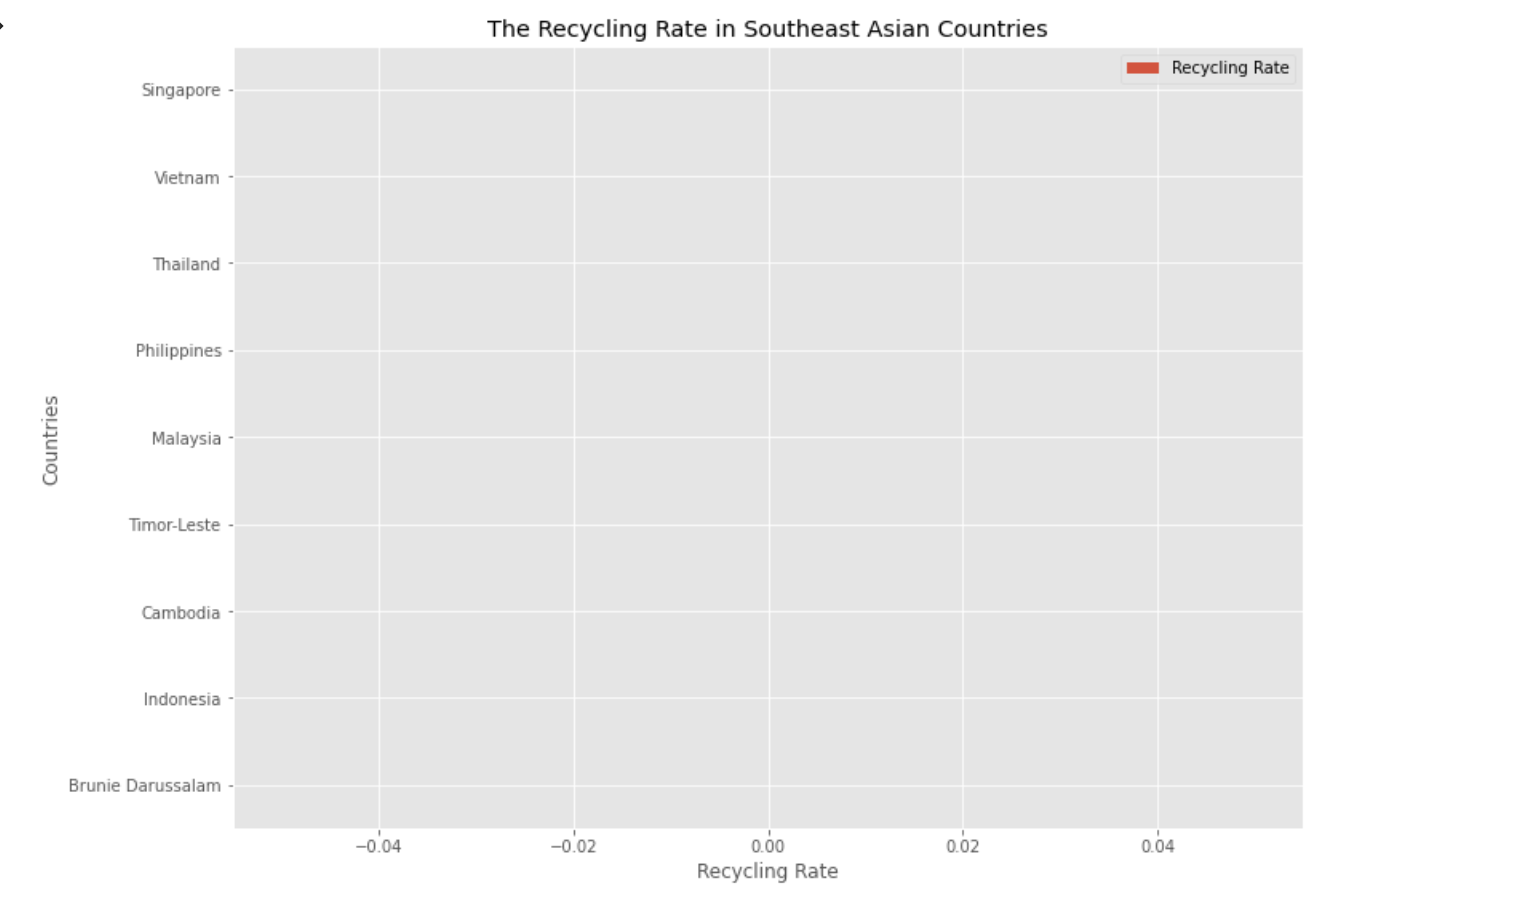
The Recycling Rate in Southeast Asian Countries Recycling Rate Singapore - Vietnam Thailand Philippines - Countries Malaysia Timor-Leste Cambodia Indonesia Brunie Darussalam -0.04 -0.02 0.02 0.60 Recycling Rate 0.64
Step by Step Solution
There are 3 Steps involved in it

Get step-by-step solutions from verified subject matter experts