

Question: import numpy as np import matplotlib.pyplot as plt ''' Common values for all modulation techniques ''' samp_rate = 50 # 50 samples/s bitrate = 1
import numpy as np import matplotlib.pyplot as plt
''' Common values for all modulation techniques ''' samp_rate = 50 # 50 samples/s bitrate = 1 # 1 bits/s - 1 symbol = 1 bit
carr_freq = 2 # Hz dfreq = 1 # Hz
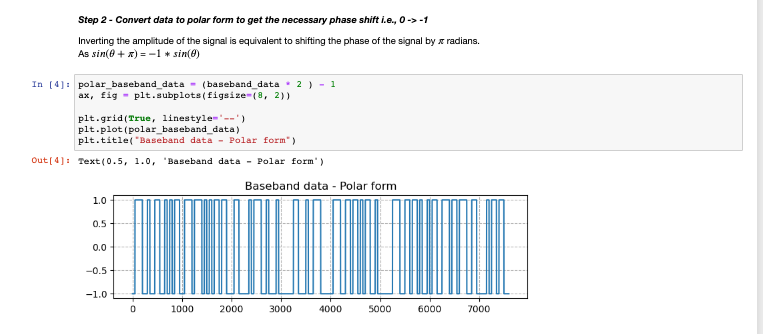
Step 2 - Convert data to polar form to get the necessary phase shift i.e., 01 Inverting the amplitude of the signal is equivalent to shifting the phase of the signal by radians. As sin(+)=1sin() 4]: polar_baseband_data = (baseband_data * 2 ) - 1 ax, fig = plt.subplots(figsize-(8, 2)) plt.grid(True, linestyle-"-.') plt.plot(polar_baseband_data) plt.title("Baseband data - Polar form") 4]: Text (0.5,1.0, "Baseband data - Polar form")
Step by Step Solution
There are 3 Steps involved in it
1 Expert Approved Answer
Step: 1 Unlock

Question Has Been Solved by an Expert!
Get step-by-step solutions from verified subject matter experts
Step: 2 Unlock
Step: 3 Unlock