

Question: IMPORTANT ASAP !!!! The figure below represents ABC analysis where sales and frequency have been taken into account High frequency AA Higher sales AB Low
IMPORTANT ASAP !!!! 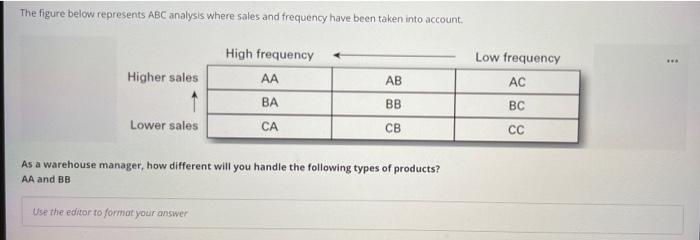
Step by Step Solution
There are 3 Steps involved in it
1 Expert Approved Answer
Step: 1 Unlock

Question Has Been Solved by an Expert!
Get step-by-step solutions from verified subject matter experts
Step: 2 Unlock
Step: 3 Unlock