

Question: **Important Note** all the boxes that are green are correct. everything else is wrong Selected financial information (in millions, except per share information) is available
 **Important Note** all the boxes that are green are correct. everything else is wrong
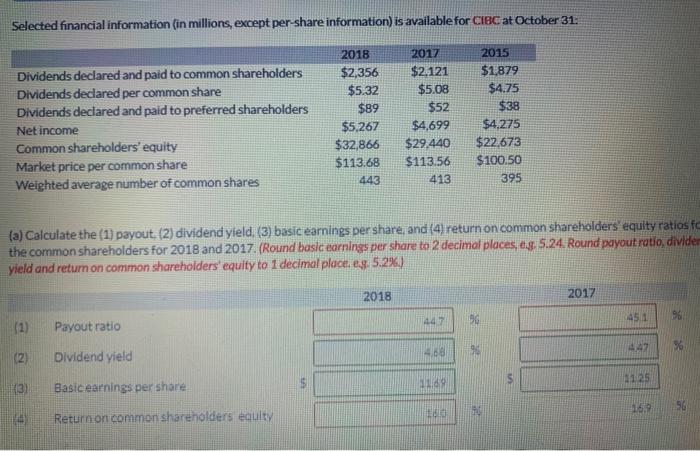
Selected financial information (in millions, except per share information) is available for CIBC at October 31: Dividends declared and paid to common shareholders Dividends declared per common share Dividends declared and paid to preferred shareholders Net income Common shareholders' equity Market price per common share Weighted average number of common shares 2018 $2,356 $5.32 $89 $5,267 $32,866 $113.68 443 2017 $2,121 $5.08 $52 $4,699 $29.440 $113.56 413 2015 $1,879 $4.75 $38 $4.275 $22,673 $100.50 395 (a) Calculate the (1) payout. (2) dividend yield, (3) basic earnings per share, and (4) return on common shareholders equity ratios fc the common shareholders for 2018 and 2017. (Round basic earnings per share to 2 decimal places, eg: 5.24. Round payout ratio, divider yield and return on common shareholders' equity to 1 decimal place. eg. 5.2%) 2018 2017 1447 190 451 Payout ratio 47 Dividend yield -68 1125 3) Basic earnings per share 09 16.9 36 Return on common shareholders equlty
Step by Step Solution
There are 3 Steps involved in it

Get step-by-step solutions from verified subject matter experts