

Question: IMPORTANT: SHOW FULL STEPS 0F CALCULATION (a) An analyst intends to analyse the seasonal pattern in the number of calls received by the contact centre
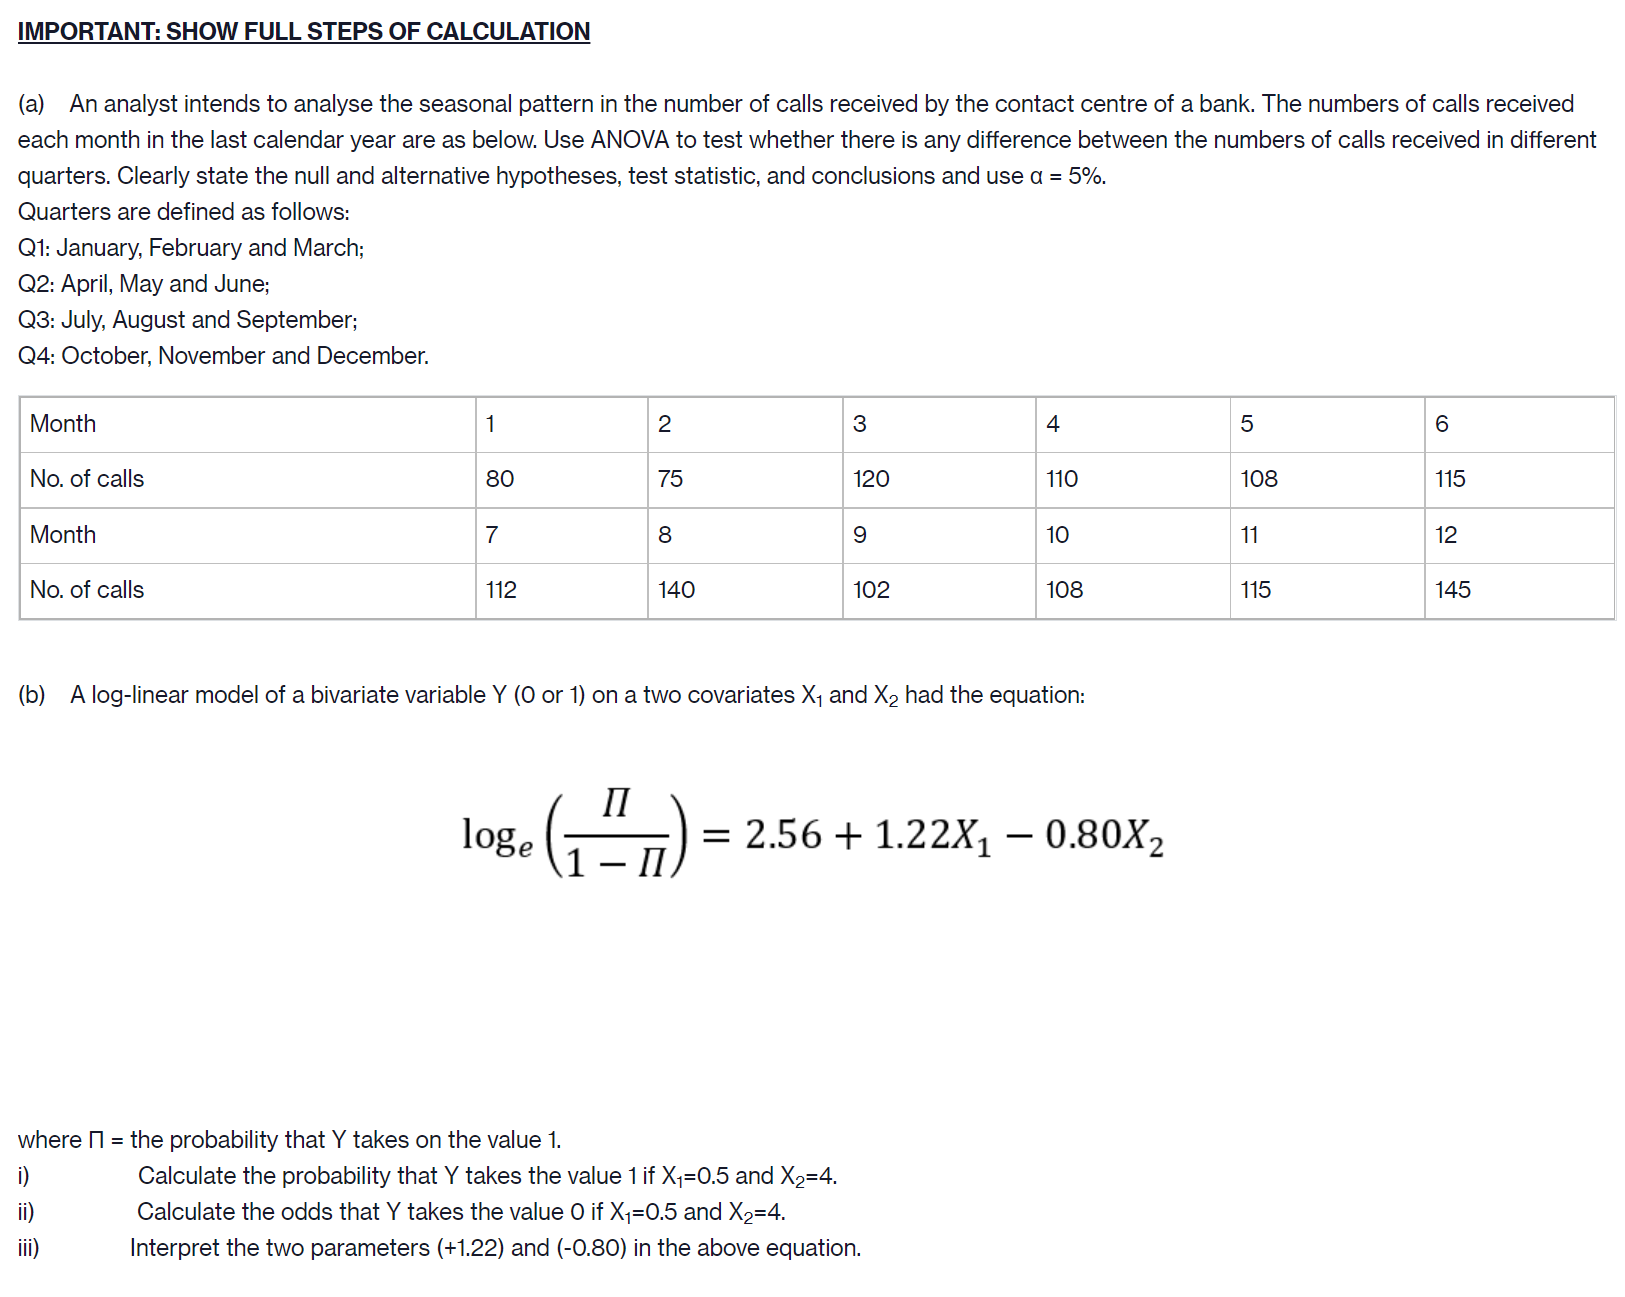
IMPORTANT: SHOW FULL STEPS 0F CALCULATION (a) An analyst intends to analyse the seasonal pattern in the number of calls received by the contact centre of a bank. The numbers of calls received each month in the last calendar year are as below. Use ANOVA to test whether there is any difference between the numbers of calls received in different quarters. Clearly state the null and alternative hypotheses. test statistic, and conclusions and use 01 = 5%. Quarters are defined as follows: Qt: January, February and March; Q2: April, May and June; 03: July, August and September; Q4: October. November and December. Month 1 2 3 4 5 6 No. of calls 80 75 120 110 108 115 Month 7 8 9 10 11 12 No. of calls 112 140 102 108 115 145 (b) A log-linear model of a bivariate variable Y (0 or 1) on a two covariates X1 and X2 had the equation: H loge (m) = 2.56 + 1.22X1 0.80X2 where H = the probability that Y takes on the value 1. i) Calculate the probability that Y takes the value 1 if X1=0.5 and X2=4. ii) Calculate the odds that Y takes the value 0 it X1=O.5 and X2=4. iii) Interpret the two parameters (+1.22) and (-0.80) in the above equation
Step by Step Solution
There are 3 Steps involved in it

Get step-by-step solutions from verified subject matter experts