

In 1981 the British government conducted a survey on household spending on tobacco products and alcoholic...
Fantastic news! We've Found the answer you've been seeking!
Question:
Transcribed Image Text:
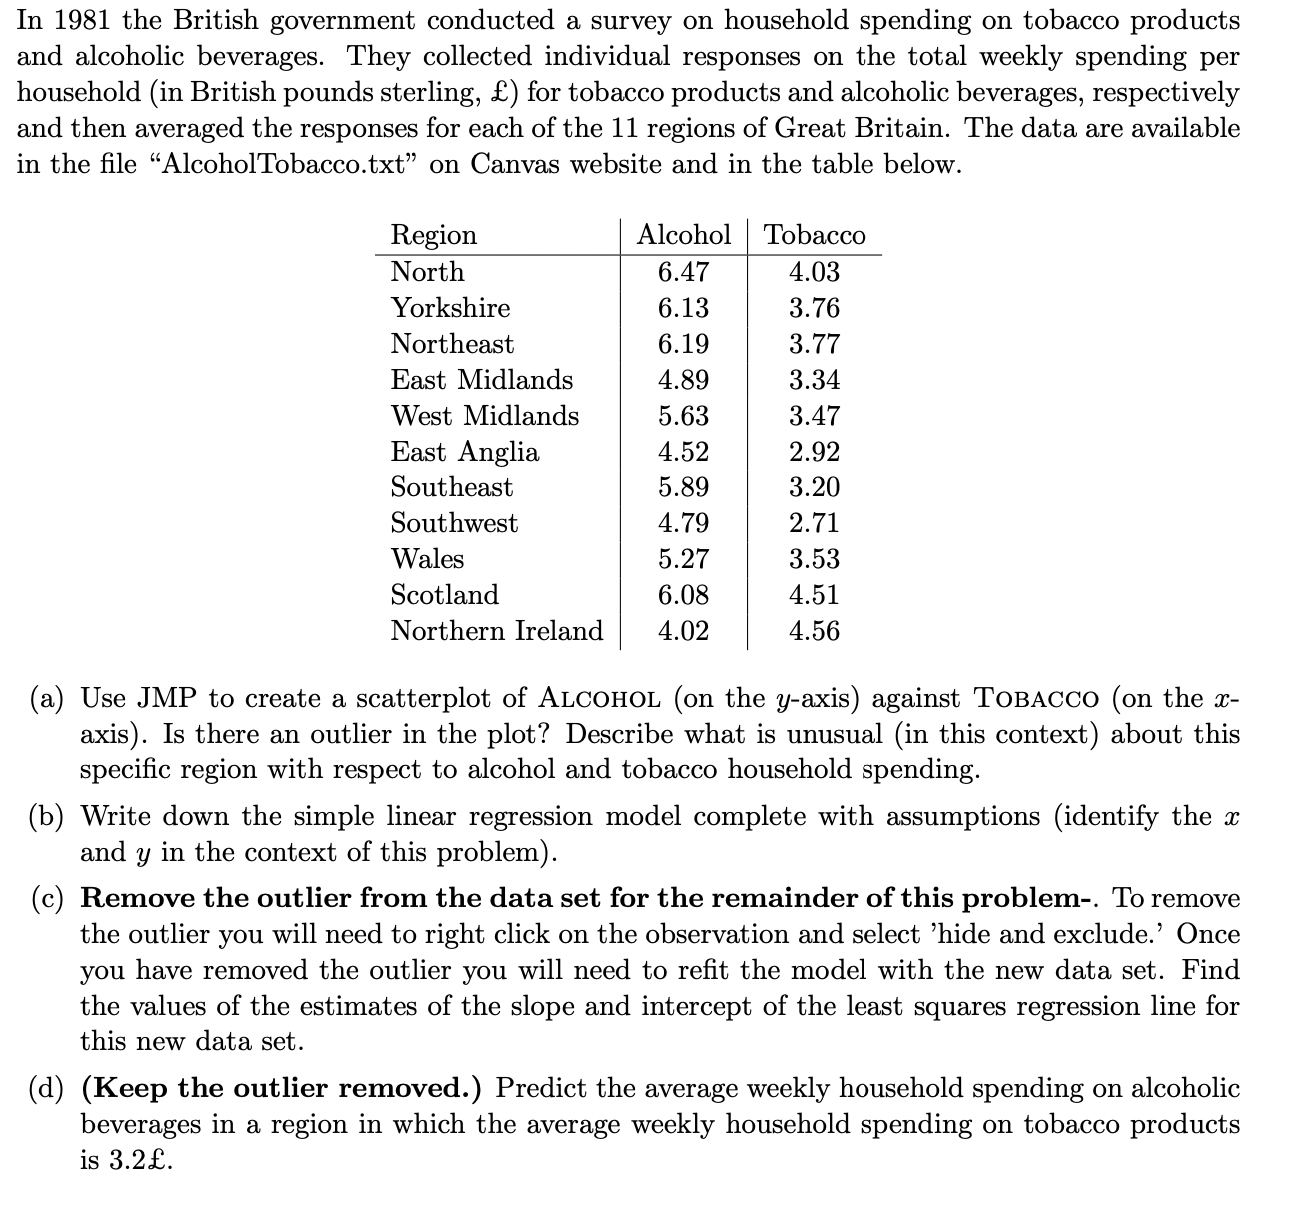
In 1981 the British government conducted a survey on household spending on tobacco products and alcoholic beverages. They collected individual responses on the total weekly spending per household (in British pounds sterling, ) for tobacco products and alcoholic beverages, respectively and then averaged the responses for each of the 11 regions of Great Britain. The data are available in the file "Alcohol Tobacco.txt" on Canvas website and in the table below. Region North Alcohol Tobacco 6.47 4.03 Yorkshire 6.13 3.76 Northeast 6.19 3.77 East Midlands 4.89 3.34 West Midlands 5.63 3.47 East Anglia 4.52 2.92 Southeast 5.89 3.20 Southwest 4.79 2.71 Wales 5.27 3.53 Scotland 6.08 4.51 Northern Ireland 4.02 4.56 (a) Use JMP to create a scatterplot of ALCOHOL (on the y-axis) against TOBACCO (on the x- axis). Is there an outlier in the plot? Describe what is unusual (in this context) about this specific region with respect to alcohol and tobacco household spending. (b) Write down the simple linear regression model complete with assumptions (identify the x and y in the context of this problem). (c) Remove the outlier from the data set for the remainder of this problem-. To remove the outlier you will need to right click on the observation and select 'hide and exclude.' Once you have removed the outlier you will need to refit the model with the new data set. Find the values of the estimates of the slope and intercept of the least squares regression line for this new data set. (d) (Keep the outlier removed.) Predict the average weekly household spending on alcoholic beverages in a region in which the average weekly household spending on tobacco products is 3.2. In 1981 the British government conducted a survey on household spending on tobacco products and alcoholic beverages. They collected individual responses on the total weekly spending per household (in British pounds sterling, ) for tobacco products and alcoholic beverages, respectively and then averaged the responses for each of the 11 regions of Great Britain. The data are available in the file "Alcohol Tobacco.txt" on Canvas website and in the table below. Region North Alcohol Tobacco 6.47 4.03 Yorkshire 6.13 3.76 Northeast 6.19 3.77 East Midlands 4.89 3.34 West Midlands 5.63 3.47 East Anglia 4.52 2.92 Southeast 5.89 3.20 Southwest 4.79 2.71 Wales 5.27 3.53 Scotland 6.08 4.51 Northern Ireland 4.02 4.56 (a) Use JMP to create a scatterplot of ALCOHOL (on the y-axis) against TOBACCO (on the x- axis). Is there an outlier in the plot? Describe what is unusual (in this context) about this specific region with respect to alcohol and tobacco household spending. (b) Write down the simple linear regression model complete with assumptions (identify the x and y in the context of this problem). (c) Remove the outlier from the data set for the remainder of this problem-. To remove the outlier you will need to right click on the observation and select 'hide and exclude.' Once you have removed the outlier you will need to refit the model with the new data set. Find the values of the estimates of the slope and intercept of the least squares regression line for this new data set. (d) (Keep the outlier removed.) Predict the average weekly household spending on alcoholic beverages in a region in which the average weekly household spending on tobacco products is 3.2.
Expert Answer:

Posted Date:
Students also viewed these mathematics questions
-
You are composing a two-stock portfolio consisting of 40 percent Stock Xand 60 percent Stock Y. Given the following information, find the standard deviation of this portfolio. Company Beta Expected...
-
This assignment requires you to complete the 2022 tax reporting for a fictional woman named Anna Smith. Question 1 T1 - step 4 - line 66 This is Anna's taxable income Answer: Question 2 T1 - step...
-
A researcher wanted to find out if there was difference between older movie goers and younger movie goers with respect to their estimates of a successful actors income. The researcher first...
-
A score of X = 75 is measured in a population with a mean of = 100. A z-score of z = +1.50 is calculated. Without knowing the standard deviation, explain why the z-score of z = +1.50 is incorrect.
-
Consider a Poisson probability distribution with l = 3.0. Determine the following probabilities. a. P(x = 3) b. P(x < 2) c. P(x > 4)
-
This chapter has described severalmajor advantages of a database system.What are two disadvantages?
-
What might be the reason that movie studios do not produce G-rated movies as much as R-rated ones?
-
Unique Exclusive sells antiques to discerning clients. The business has developed the following business objectives: 1. To buy only the antiques that sell 2. To have repeat customers 3. To be...
-
More Info TIME60 Y = Elapsed Time (In Seconds) From 0 Mph To 60 Mph MAX: X1 = Maximum Speed Attained (Miles Per Hour) UNWEIGHTED LEAST SQUARES LINEAR REGRESSION OF TIME60 PREDICTOR | COEFFICIENTI STD...
-
DelRay Foods must purchase a new gumdrop machine. Two machines are available. Machine 7745 has a first cost of $1,400, an estimated life of 10 years, a salvage value of $1,000, and annual operating...
-
Briefly describe the types of costs that this project would have incurred and provide two examples under any of the categories of costs. See project case below. Virgin Galactic has reopened ticket...
-
How can organizations measure and demonstrate the return on investment (ROI) of their change management efforts, and what metrics should be prioritized to capture the full range of tangible and...
-
How might advancements in computational modeling and simulation facilitate predictive analyses of resilience trajectories at both individual and collective levels?
-
1.What potential solutions have been proposed by regulators in Australia and other countries? 2.Any research evidence supporting the effectiveness of the proposed solutions? 3.How do Big 4 dominance...
-
Combine the following simple sentences into one complex sentence, using either a subordinate conjunction or a relative pronoun. (There are several possible answers to each question.) For speed, you...
-
3. Draw a Gaussian sunface no that one can estimate the electric 22 field at point P. 4. A uniformly changed conducting GS15) Sr sphere of 1.2m nadius has a nurface charge dennity &1uCm Find the net...
-
Using Apple, demonstrate how the differentiation strategy can be well implemented.
-
Eagle Outfitter's store in Butte, Montana, is projecting sales as follows: January, \$50,000; February, \$80,000; March, \$40,000; April, \$50,000. Cash sales are \(60 \%\) of total sales; credit...
-
Eagle Outfitters expects revenue of \(\$ 2,000\) in June, \(\$ 1,500\) in July, and \(\$ 1,800\) in August for sales of hiking socks. Suppose the cost of goods sold averages \(40 \%\) of sales....
-
Refer to the information in S22-6. Suppose cost of goods sold averages \(75 \%\) of sales. Ending inventory is \(\$ 20,000\) plus \(80 \%\) of cost of goods sold for next month. January 1 inventory...

Study smarter with the SolutionInn App