

Question: In a certain year, most electricity was generated from coal (33%), natural gas (31%), or nuclear power plants (20%). Hydropower accounted for 8% of the
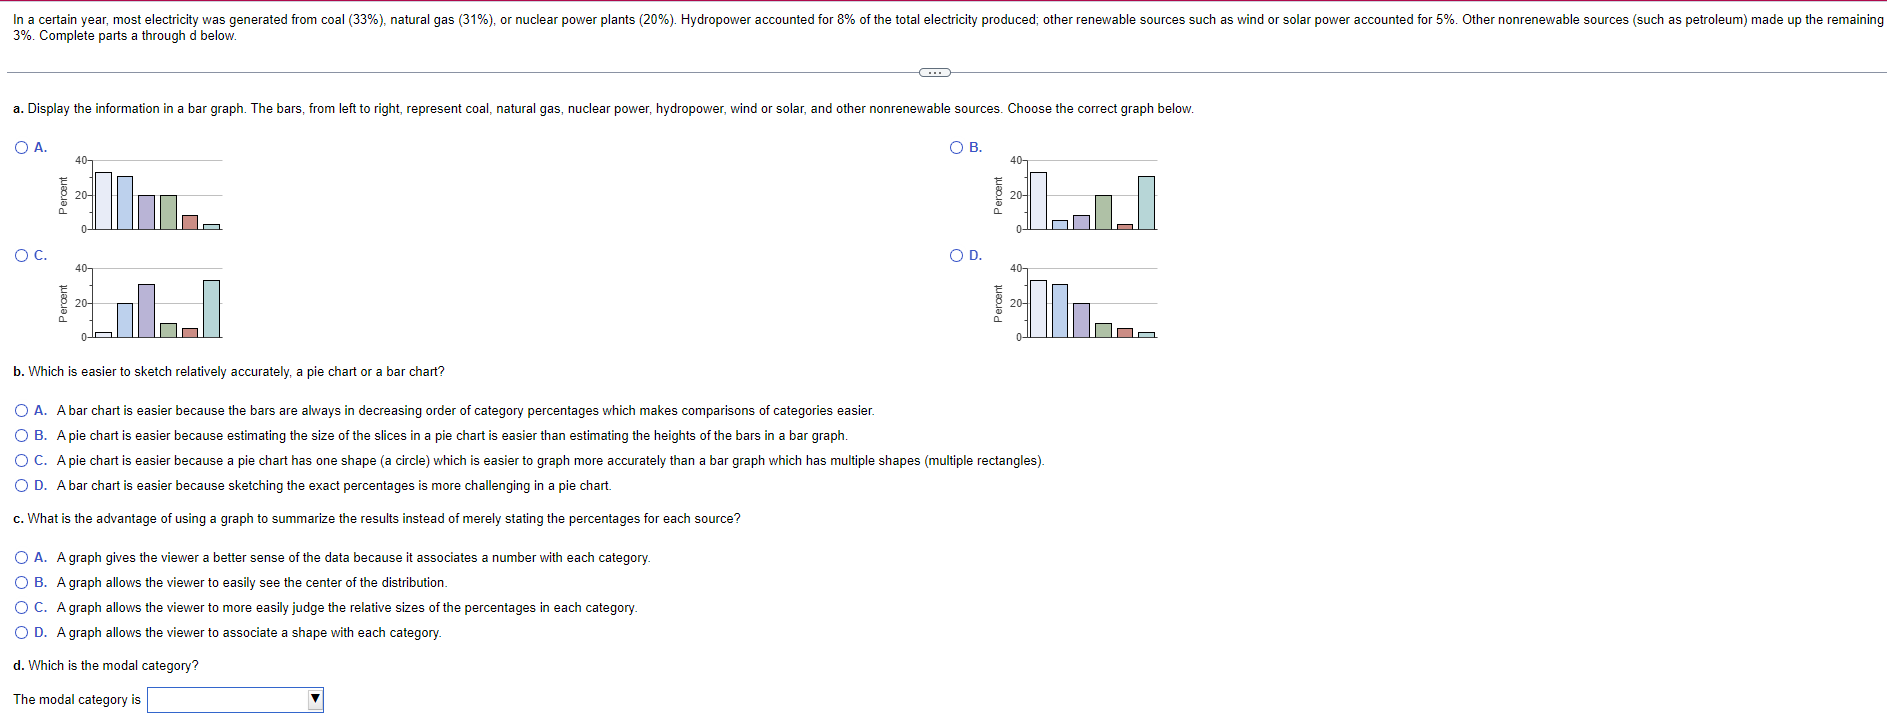

In a certain year, most electricity was generated from coal (33%), natural gas (31%), or nuclear power plants (20%). Hydropower accounted for 8% of the total electricity produced; other renewable sources such as wind or solar power accounted for 5%. Other nonrenewable sources (such as petroleum) made up the remaining 3%. Complete parts a through d below. the information in a bar graph. The bars, from left to right, represent coal, natural gas, nuclear power, hydropower, wind or solar, and other nonrenewable sources. Choose the correct graph below. A. OB. 40- 40- Percent 20- Percent 20 O C. OD. 40- 40- Percent Percent 20- b. Which is easier to sketch relatively accurately, a pie chart or a bar chart? O A. A bar chart is easier because the bars are always in decreasing order of category percentages which makes comparisons of categories easier. O B. A pie chart is easier because estimating the size of the slices in a pie chart is easier than estimating the heights of the bars in a bar graph. O C. A pie chart is easier because a pie chart has one shape (a circle) which is easier to graph more accurately than a bar graph which has multiple shapes (multiple rectangles). O D. A bar chart is easier because sketching the exact percentages is more challenging in a pie chart c. What is the advantage of using a graph to summarize the results instead of merely stating the percentages for each source? O A. A graph gives the viewer a better sense of the data because it associates a number with each category. O B. A graph allows the viewer to easily see the center of the distribution. O C. A graph allows the viewer to more easily judge the relative sizes of the percentages in each category. O D. A graph allows the viewer to associate a shape with each category. d. Which is the modal category? The modal category is
Step by Step Solution
There are 3 Steps involved in it

Get step-by-step solutions from verified subject matter experts