

Question: . In a large portfolio, we usually need to do a factor analysis to find some common factors such as market index, interest rates and
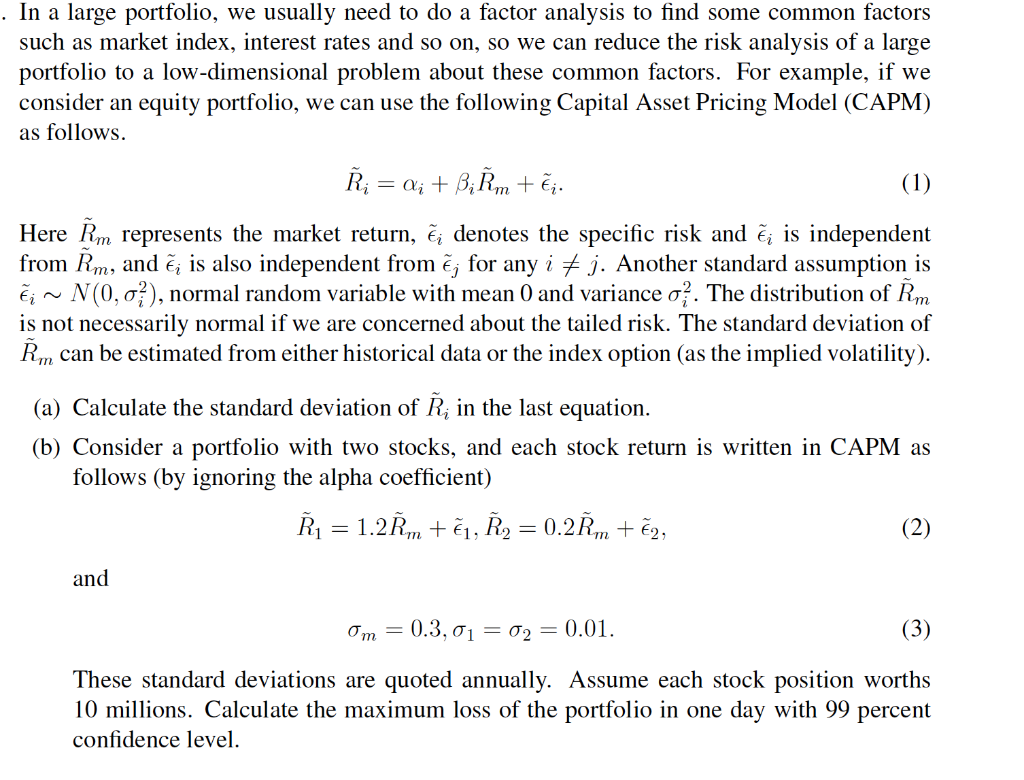
. In a large portfolio, we usually need to do a factor analysis to find some common factors such as market index, interest rates and so on, so we can reduce the risk analysis of a large portfolio to a low-dimensional problem about these common factors. For example, if we consider an equity portfolio, we can use the following Capital Asset Pricing Model (CAPM) as follows. ; = Qi + B;m + i (1) Here m represents the market return, i denotes the specific risk and i is independent from Rm, and j is also independent from ; for any i + j. Another standard assumption is i ~ N(0,01), normal random variable with mean 0 and variance oz. The distribution of m is not necessarily normal if we are concerned about the tailed risk. The standard deviation of m can be estimated from either historical data or the index option (as the implied volatility). (a) Calculate the standard deviation of ; in the last equation. (b) Consider a portfolio with two stocks, and each stock return is written in CAPM as follows (by ignoring the alpha coefficient) = 1.2m + i, , = 0.2m + a, (2) and Om = 0.3,01 = 02 = 0.01. (3) These standard deviations are quoted annually. Assume each stock position worths 10 millions. Calculate the maximum loss of the portfolio in one day with 99 percent confidence level. . In a large portfolio, we usually need to do a factor analysis to find some common factors such as market index, interest rates and so on, so we can reduce the risk analysis of a large portfolio to a low-dimensional problem about these common factors. For example, if we consider an equity portfolio, we can use the following Capital Asset Pricing Model (CAPM) as follows. ; = Qi + B;m + i (1) Here m represents the market return, i denotes the specific risk and i is independent from Rm, and j is also independent from ; for any i + j. Another standard assumption is i ~ N(0,01), normal random variable with mean 0 and variance oz. The distribution of m is not necessarily normal if we are concerned about the tailed risk. The standard deviation of m can be estimated from either historical data or the index option (as the implied volatility). (a) Calculate the standard deviation of ; in the last equation. (b) Consider a portfolio with two stocks, and each stock return is written in CAPM as follows (by ignoring the alpha coefficient) = 1.2m + i, , = 0.2m + a, (2) and Om = 0.3,01 = 02 = 0.01. (3) These standard deviations are quoted annually. Assume each stock position worths 10 millions. Calculate the maximum loss of the portfolio in one day with 99 percent confidence level
Step by Step Solution
There are 3 Steps involved in it

Get step-by-step solutions from verified subject matter experts